
The month ends today, and this gold price forecast for November 2026 does three things.
It scores the gold price forecast for October 2026 that I published on September 30, it explains the forces behind today's moves, and it lays out my gold price prediction for November 2026.
At the moment of writing these words, December gold futures trade near $3,906, after falling to $3,900.90 earlier today, a new 2026 low. Silver fell to $49.08, below $50 for the first time since early November 2025, and the GDXJ, the ETF for junior mining stocks, is down about 5 percent. Stocks are sliding too, with the Nasdaq Composite down about 2.6 percent.
What the Gold Price Forecast for October 2026 Got Right
On September 30, I wrote: "The gold price prediction for October is that they have further to go even if the next few days bring us a rebound."
They did. From the September 29 closes I used in that analysis to Thursday's closes, gold futures fell 3.5 percent, silver futures 14.3 percent, and the GDXJ 12.8 percent, while the 10-year Treasury yield fell 30 basis points. The table below scores the specific calls.
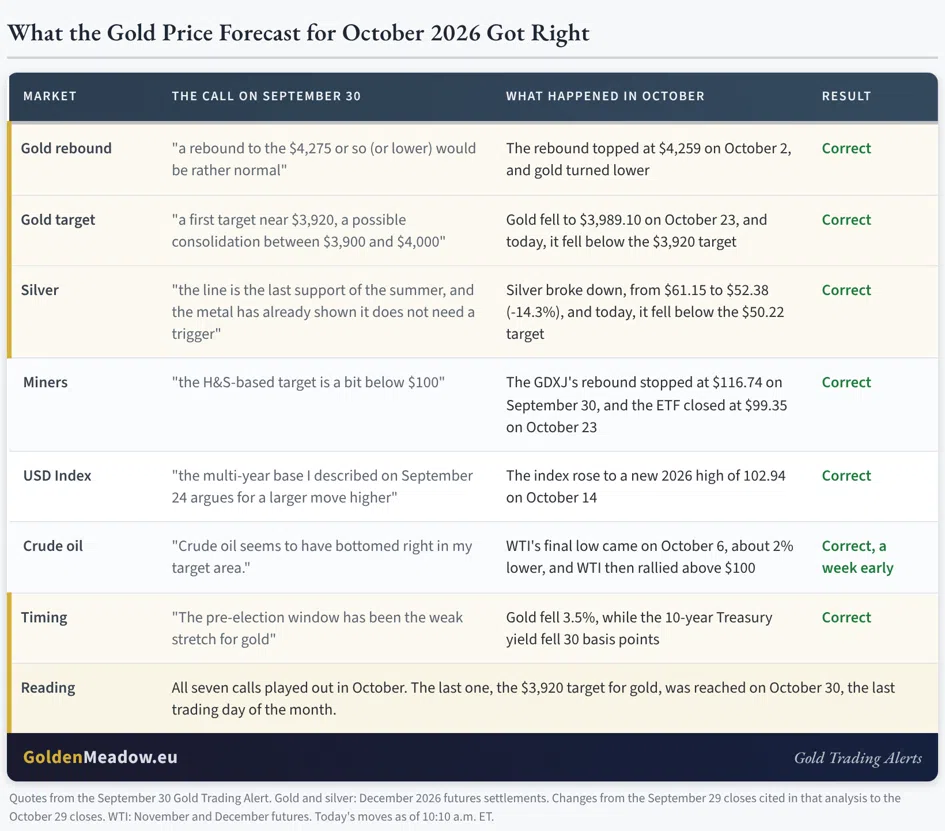
All seven calls played out, and the last one did so today.
On the rebound, I wrote that "a rebound to the $4,275 or so (or lower) would be rather normal." Gold's rebound topped at $4,259 on October 2, and gold hasn't traded above this level since.
On the dollar, I wrote that "the multi-year base I described on September 24 argues for a larger move higher." The USD Index rose to a new 2026 high of 102.94 on October 14, and so far, its pullback has stopped at the previous highs.
On the target, I wrote about "a first target near $3,920." Today, December gold futures fell to $3,900.90.
Gold Falls Below the $3,920 Target
Gold reached its target on the last trading day of the month.
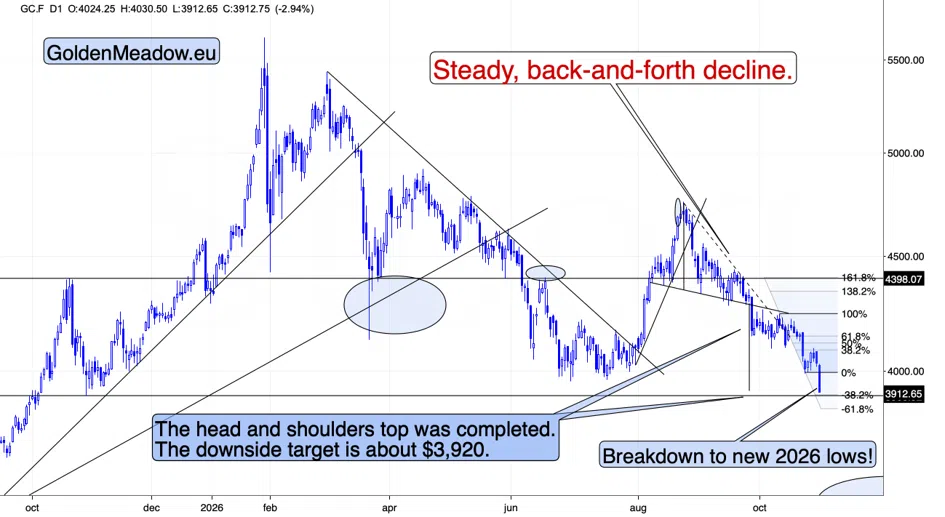
December gold futures fell $20.20 on Thursday to $4,031.40, and today, they moved below $3,920. Yesterday, I wrote: "The head-and-shoulders top on the above chart was completed, and its downside target is about $3,920." It took gold one more session to get there. Spot gold is now about 30 percent below its January 29 top of $5,595.
A head-and-shoulders top has three peaks, with the middle one, the head, higher than the two shoulders around it. The line connecting the lows between the peaks is the neckline. Once the price breaks below the neckline, the pattern is completed, and the classic way to set its target is to take the distance from the head to the neckline and measure it down from the neckline. The $3,920 target on the above chart comes from this pattern.
The decline came on a day that should have supported gold. The 10-year Treasury yield fell to 4.91 percent, its lowest level in seven weeks, and lower bond yields reduce the cost of holding gold, which pays no interest. The USD Index fell this morning too. In yesterday's article, I also wrote: "Gold had reasons to rally today, and it took none of them." Today, it had even more reasons, and it fell further.
Why Gold Falls When Stocks Fall
Today's declines started in big tech.
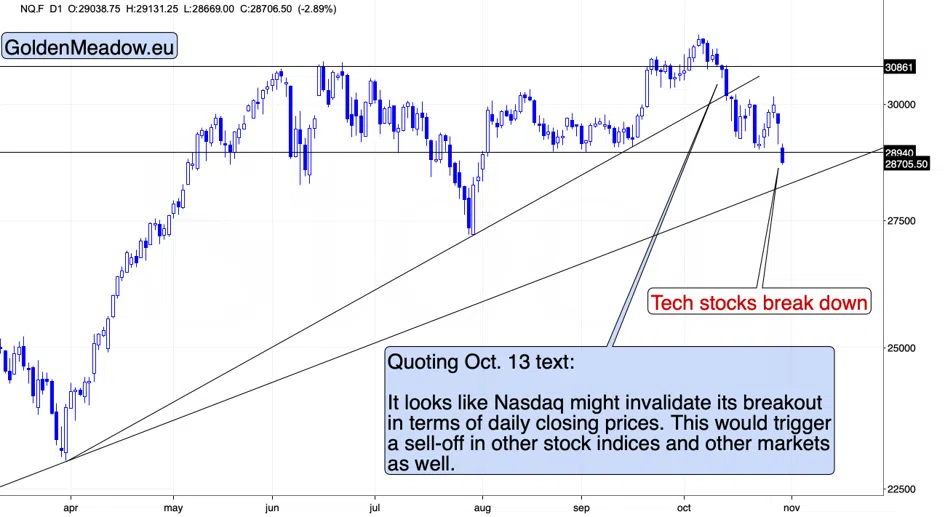
After Thursday's close, Intel and Amazon reported, and according to Reuters, both showed cash burn, which deepened the doubts about whether the huge spending on AI will pay off. Today, Intel is down about 30 percent, the Nasdaq Composite about 2.6 percent, and the S&P 500 about 1.6 percent.
Many investors think of gold as a safe haven, so they expect it to rise when stocks fall. In the first stage of a sell-off, it often works the other way, for two reasons.
The first reason is selling for cash. When stocks fall fast, leveraged investors get margin calls, and they need cash quickly. They sell what's liquid and what still shows a profit, and gold is both. In March 2020, gold fell 12 percent in eight trading days during the scramble for cash, and it turned higher only after the Fed cut rates to near zero and started buying bonds without limits. In 2026, the Fed is debating hikes, not cuts. This is how a liquidity crunch hits gold.
The second reason is positioning. According to the Commitments of Traders data, managed money held a net long of 108,685 gold futures contracts as of October 20. This net long was 28.2 percent smaller than eight weeks earlier, while in the four earlier streaks of this length since 2006 during which gold fell, it shrank by 72 to 81 percent. Many traders who bought gold on the way up still hold it, and each of them is a potential seller.
In my view, today's sell-off is an early stage, and stocks haven't started a massive slide yet. When they do, the selling for cash is likely to intensify.
The USD Index Turned Back Up
The USD Index fell this morning, and then it moved back up.
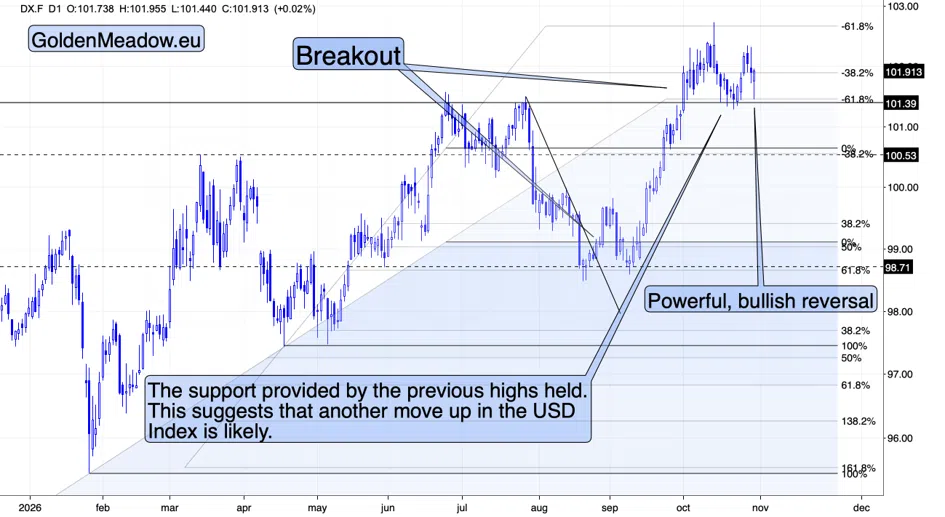
The USD Index futures fell to 101.445 in Asian trading, close to their previous highs, and then they rebounded to 101.955. They're near 101.7 now. The yen and the Swiss franc gained in the morning, as they usually do when markets slide, and the Bank of Japan left the door open to a rate hike in December, which added to the yen's strength.
The USD Index measures the dollar against six currencies. The euro has the biggest weight, 57.6 percent, followed by the Japanese yen (13.6 percent), the British pound (11.9 percent), the Canadian dollar (9.1 percent), the Swedish krona (4.2 percent), and the Swiss franc (3.6 percent). Gold is priced in dollars, so a stronger dollar makes gold more expensive for buyers who pay in other currencies, and their demand tends to weaken. This is why the correlation between gold and the USD Index is traditionally negative.
The above chart also shows how a breakout gets confirmed. When a market breaks above important resistance, such as its previous highs, it often comes back to test this level from above. If the level holds, the old resistance turns into support. The USD Index broke above its previous highs, rose to the 2026 high of 102.94 on October 14, and then pulled back to the previous highs. This morning, it bounced from them again. In my view, the support holding suggests another move up in the USD Index, and this is bearish for gold.
Crude Oil Breaks Higher
Crude oil is rising for its own reasons.
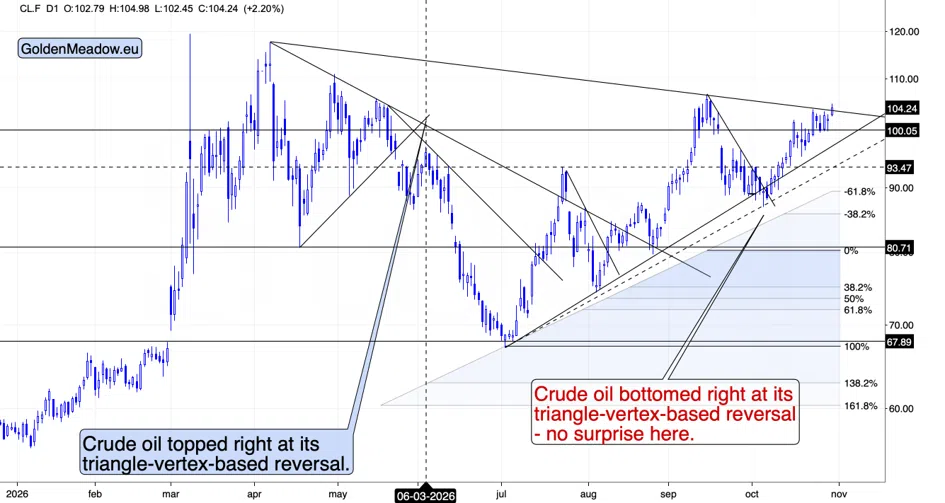
December WTI futures are near $104, up about 2 percent today, after a new attack near the Strait of Hormuz. Late on Thursday, a small boat attached two explosive devices to a tanker's hull about 25 nautical miles northeast of Khasab, Oman, according to the UKMTO, and the crew is safe. Iran hasn't replied to Vice President Vance's letter yet, and according to The Wall Street Journal, President Trump told Gulf allies to prepare for a brief, intense campaign against Iran after the midterms.
On September 30, I wrote: "Crude oil seems to have bottomed right in my target area." The final low came on October 6, and today, December WTI trades about 21 percent above that day's low. In yesterday's article, I wrote: "Technically, crude oil paused at its declining resistance line." Today, crude oil is breaking above it.
The above chart also shows a timing technique I use: triangle-vertex-based reversals. When two converging lines, such as a support line and a resistance line, are extended, the point where they cross, the vertex, often marks a turning point in time. The direction of the move into the vertex matters. A decline into it tends to end with a bottom, and a rally into it tends to end with a top. On the above chart, crude oil topped in early June right at one of these reversals, and it bottomed in early October right at another.
In yesterday's article, I also wrote: "For gold, the oil link runs through rates, as higher oil means more inflation and higher rates." Here's how this works. Oil feeds into inflation directly, through fuel prices, and indirectly, through transport and production costs. Higher inflation makes the Fed more likely to keep interest rates high or raise them, and higher rates increase the cost of holding gold, which pays no interest. They also tend to support the dollar. This is one of the reasons why gold fell in October while crude oil rallied, even though gold is often called an inflation hedge. Geopolitical news, such as attacks near Hormuz, can lift gold for a day, but in my view, the rate channel is the more durable force.
Silver Falls Below $50
Silver fell harder than gold again.
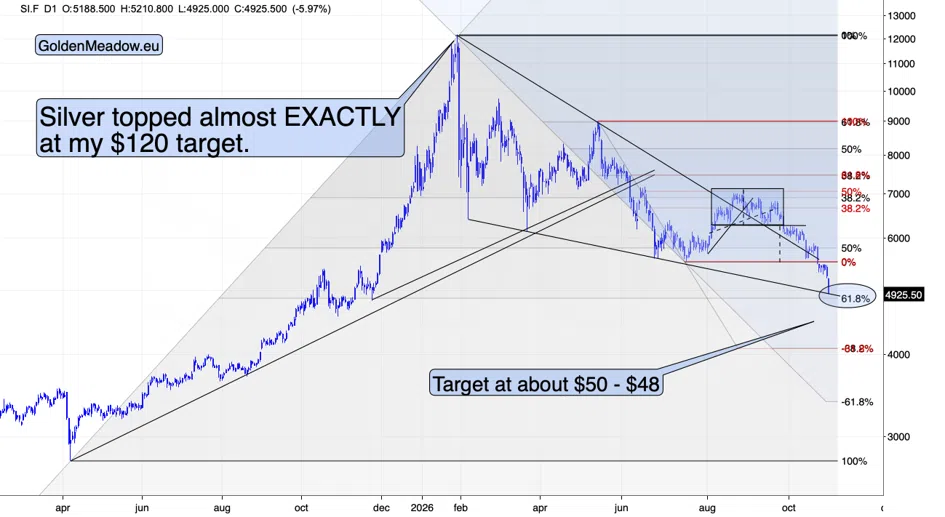
Today, December silver futures fell to $49.08, the lowest level since November 4, 2025. On October 8, I wrote that "the move below $50 remains the medium-term outlook." Silver closed at $59.42 that day, so it has fallen about 17 percent since then, while gold has fallen about 6 percent.
The target area on the above chart is at about $48-$50, and silver is in it now. In my view, silver is likely to form an intermediate bottom in this area within the next two trading days, perhaps even today. I don't think it will be the final bottom. Silver reacts to the stock market more than gold does, and stocks haven't started a massive slide yet.
The gold-to-silver ratio shows how many ounces of silver one ounce of gold buys, and it's one of the tools I use to time tops and bottoms in the precious metals sector. Silver is a much smaller market than gold and partly an industrial metal, so it draws more speculative money and reacts more to the economy and to stocks. Late in a rally, investors chase silver, so silver outperforms gold, and the ratio falls. In a decline, silver usually falls harder, so the ratio rises. In early December 2025, the ratio was about 74, and on January 27, 2026, it fell to 46.2, a 37 percent drop in less than two months. Two days later, gold and silver topped.
In the October 8 article, I also wrote: "A rising ratio is what precious metals declines look like, and 70 is not an extreme." The ratio was near 70 then, and it's about 79 today. I expect it to rise toward the 80-84 range of the previous bottoms. With gold at about $3,500, this would put silver at about $42-$44.
Gold Price Prediction for November 2026
With the first target reached, the next one is about $3,500. The table below puts the key levels in one place.
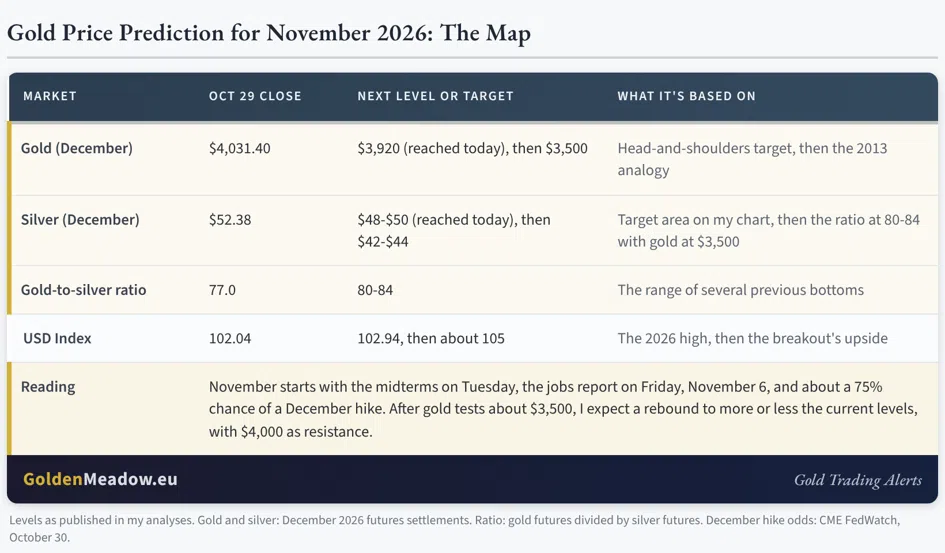
Once gold tests about $3,500, I expect a rebound to more or less the current levels, with gold verifying $4,000 as resistance. After the rebound, I expect gold to fall to the low $3,000s or even lower, with $2,700-$2,800 as the lower border of my target area.
The USD Index is likely to play a big role in this. In my view, its next big move is up, and a rising dollar would add to the pressure on gold. November starts with the midterms on Tuesday, November 3, and the October jobs report comes out on Friday, November 6.
Gold Price Forecast for November 2026: Key Questions
Here are short answers to the key questions about the months ahead.
What is the gold price forecast for November 2026?
In my view, the decline in gold has further to go. Gold reached my first target of $3,920 on October 30, and the next one is about $3,500. After gold tests about $3,500, I expect a rebound toward $4,000, which is likely to work as resistance.
What is the silver price prediction for November 2026?
Silver reached the $48-$50 target area on October 30. In my view, an intermediate bottom is likely there within the next two trading days, but the final bottom is likely lower, at about $42-$44, with the gold-to-silver ratio in the 80-84 range.
What would change this gold price prediction for November 2026?
A sign that gold is bottoming. In my view, the lasting bottom in gold is likely to form while the USD Index is still rising, and the sign of it will be gold reacting less and less to the dollar's strength: falling less on the dollar's up days, and then not falling at all. Silver and the miners leading gold higher would be another sign. Today, they're leading it lower.
Where This Leaves Us
October confirmed all seven calls from the October forecast. Gold fell below the $3,920 target today, even with yields lower, silver fell below $50, and the miners are at their lowest levels since early August.
The gold price prediction for October was that the declines have further to go. The gold price prediction for November 2026 is that they still do, with about $3,500 as the next target for gold.
Gold reached the October target on the last day of October.
You were prepared. Not to the extent that my subscribers were, but still. If you profited from those declines – congratulations.
Important note: the forecasts are up-to-date at the moment of their publication, we don’t guarantee updating them for free readers. We will, however, keep our premium subscribers updated at all times.
Thank you for reading the free version of today’s analysis. The premium version (Gold Trading Alert) includes more specific analysis of gold, silver, and mining stocks as well as profit-take levels for our positions, and subscribers also get the Leveraged ETF Calculator with up-to-date levels for leveraged and inverse funds. Diamond Members get to enjoy also over ten other premium publications at the fraction of their individual prices. If that might be of interest to you, I invite you to review our premium services. And if you’re not yet on it, I invite you to join our free gold newsletter today.
Thank you.
Sincerely,
Przemysław K. Radomski, CFA