Silver is trading near $85. The gold-silver ratio just compressed from 62.25 to 55.46 in fourteen days. And the Fed just cast its most divided vote in 34 years, against a backdrop that has historically been among silver's strongest.
Silver crossed $85 this week on the back of two separate 6%-plus single-session moves: one on Iran peace optimism on May 7 and one on Trump-Xi summit anticipation on May 11. The gold-silver ratio compression to 55.46, with gold barely moving, tells you specifically what drove the rally: industrial demand repricing, not fear. Roughly 60% of silver demand is industrial, and most of those supply chains run through US-China trade. Markets bought silver ahead of this week's Trump-Xi summit because a trade truce continuation would be good for the industries that consume silver most heavily.
But underneath the headline move, a more structural development took place on April 29, one that I think matters more for silver over the next twelve months than any individual rally session.
In the April 15 article, I noted that March's 3.3% CPI reading confirmed the stagflation setup this newsletter has been tracking. April's CPI arrived on May 12 at 3.8%, the highest reading since May 2023, confirming March was not a one-off. The Fed now faces 3.8% inflation and a softening labor market simultaneously, and April 29 showed just how divided the institution is about what to do next.
The Fed's Most Divided Vote in 34 Years, and What History Says Happens to Silver
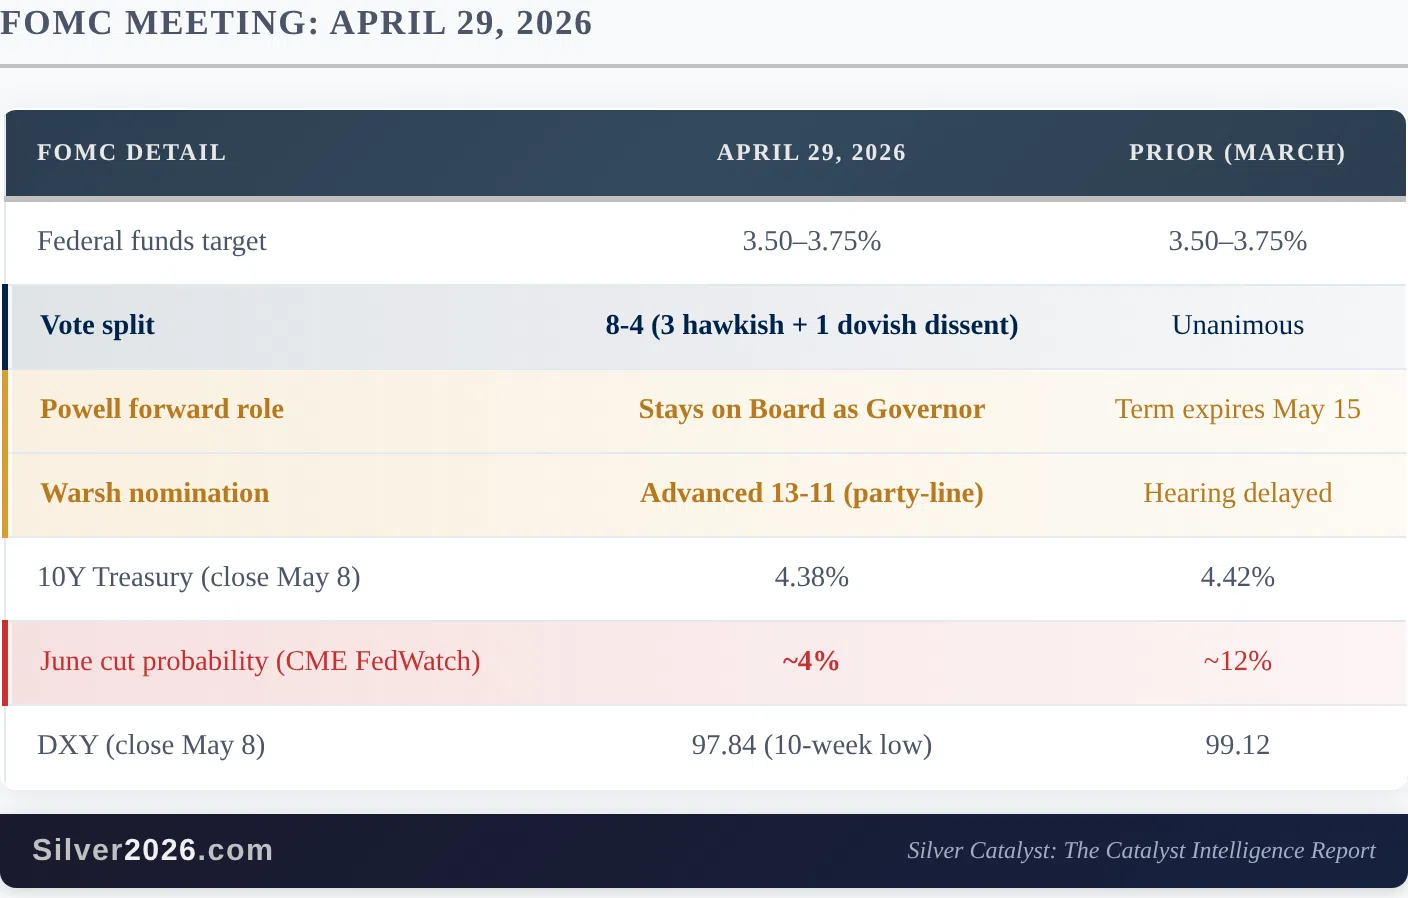
On April 29, the Federal Open Market Committee voted 8-to-4 to hold interest rates at 3.50–3.75%. The split tells the story: three governors voted that rates were too low and needed to rise; one voted they were too high and needed to fall. Jerome Powell, in his final press conference as Chair, described policy as sitting at "the high end of neutral or perhaps mildly restrictive." That is not a confident central bank. That is a central bank where the governing committee cannot agree on which direction the economy is heading, let alone what to do about it.
The same day, the Senate Banking Committee advanced Kevin Warsh's nomination to replace Powell on a 13-11 party-line vote, the first fully partisan confirmation vote on a Fed Chair in the committee's history. Powell, notably, announced he would stay on the Board as a Governor rather than leave entirely. That combination (a divided outgoing committee, a partisan confirmation process, and the outgoing Chair remaining to act as a check on his successor) has no modern precedent.
A Fed that cannot cut rates without stoking inflation and cannot raise them without choking growth is a Fed that is effectively paralysed. That environment, paired with the most politicised central bank transition in decades, is historically where silver outperforms. The historical record is specific enough to be worth examining.
Three Times the Fed Was Paralysed. Three Times Silver Moved.
Between 1978 and January 1980, the Fed oscillated between hiking into recession and cutting into inflation, never fully resolving either. Silver rose from $6.08 to $49.45, a 713% gain that went far beyond what Hunt Brothers speculation alone can explain. Inflation ran above 11% in 1974 and above 14% by 1980 per the Federal Reserve's own account. The common mechanism documented by Federal Reserve historians: the Fed could not raise rates fast enough to contain prices without collapsing employment, so every delay further eroded confidence in the currency and drove capital into silver.
Between 2008 and 2011, the Fed held rates at zero while inflation expectations rose and real yields turned negative. Silver rose from approximately $8.50 at its crisis low to $49.82 by April 2011, a gain of approximately 480%. The paralysis was different in character (the Fed was trying to stimulate a post-crisis economy, not fight inflation) but the mechanism was the same: a central bank unable to act decisively produced a weaker dollar and rising silver.
Between 2020 and 2022, unprecedented fiscal expansion met a Fed that was slow to respond to accelerating inflation. Silver rose from $12 in March 2020 to over $29 by August, more than doubling in five months. The Fed's delayed response turned a temporary inflation spike into a persistent one, and silver priced in both the monetary disorder and the industrial demand surge.
In each case the common factor was not the level of rates but the paralysis itself: a central bank unable to act decisively in either direction. Silver gained approximately 1,546% across the full decade of 1970s stagflation, as CPI averaged 7.4% annually and the Fed consistently fell behind. The April 2026 data is not yet at 1979 levels. But the structural setup is the same architecture: above-target inflation at 3.8%, softening wage growth at 0.2% monthly, a fiscal-dominance backdrop with a $2.065 trillion deficit, and a Fed whose institutional independence is now actively contested.
The dollar fell on May 8 despite a jobs report that beat consensus by 85%. That is not the normal reaction. When an economy looks healthy, capital flows into its currency. When it falls on good news, markets are forecasting something else: that the underlying monetary framework is weakening faster than the employment data suggests.
Catalyst connections:
- Catalyst #61 (Real Interest Rate Mathematical Advantages): the 8-4 split confirms the regime in which silver historically outperforms: a Fed that cannot ease into elevated inflation and cannot tighten into a softening economy.
- Catalyst #74 (Nixon Shock Parallels Creating Policy Transformation): the first fully partisan party-line Fed Chair committee vote in history, with the outgoing Chair staying on the Board, maps directly to the institutional erosion that preceded the 1970s silver rally. The parallels are now operational, not theoretical.
- Catalyst #65 (1970s Stagflation Precedent Shows Extreme Performance): the three historical episodes above (with verified price data) illustrate the mechanism: Fed paralysis erodes currency confidence, and silver captures the resulting reallocation.
What This Means
Silver at $85 is approximately 30% below its January 29 all-time high of $121.67. The paper price has moved since Issue #14, but the structural picture has not changed: the sixth consecutive annual deficit is forecast at 46.3 Moz per Metals Focus and the Silver Institute. COMEX registered inventory sits at 79.88 Moz with a coverage ratio of 13.4%, the seventh consecutive month below the 15% stress threshold. The World Silver Survey 2026 confirms total supply contracting 2% in 2026 while industrial demand holds above 650 Moz annually.
The Trump-Xi summit outcome is uncertain. The Iran situation remains unresolved. A pullback from $85 after a 12.9% move in two weeks would be normal and expected. Markets don't move in straight lines.
But the Fed situation described above is not a trading event. It is a structural shift in the monetary framework that has historically been among silver's most favourable environments. The April 29 FOMC vote and the Warsh partisan confirmation did not move the silver price that day. They changed the backdrop against which every subsequent price move will be measured.
The full Silver Catalyst Issue #15 contains five more Deep Dives covering: silver's 16-to-1 outperformance of gold on May 11 and what the ratio compression to 55.46 means for the trajectory; the Glencore Kazzinc smelter explosion in Kazakhstan and the 3.4 Moz byproduct silver that cannot be replaced; Gold Fields' first-of-kind quantification of Iran-war oil costs transmitting into the silver mine cost stack; the April CPI stagflation confirmation and its historical precedents; and Q1 2026 producer reporting showing grade decline at Hecla, First Majestic, and Endeavour simultaneously. If you want to understand where this market is headed and stay informed as it develops, I encourage you to get "Silver Rising" with complimentary 2-week access to the Silver Catalyst newsletter.
Thank you.
The Silver Engineer