Melancholy music could serenade silver in the days ahead.
Despite silver’s diversification benefits and potential for long-term returns, the current fundamentals support a final sell-off before the next bull market begins; and while the recent momentum has elicited calls for even higher prices, sentiment and positioning paint an ominous portrait of what lies ahead.
For example, silver often suffers profound drawdowns alongside the S&P 500, and with contrarian indicators signaling trouble ahead, the downside risk has increased.
Please see below:

To explain, the blue line above tracks CNN’s Fear & Greed Index. If you analyze the right side of the chart, you can see greed reigns as the bulls expect more gains. However, these sentiment extremes often mark short to medium-term peaks, because when everyone is all-in, there is no one left to buy. Then, the bullish bets unwind, asset prices fall, and the blue line declines dramatically.
As further evidence, data from Morgan Stanley signals a similar outcome.
Please see below:

To explain, Morgan Stanley’s Global Risk Demand Index has reached the greed threshold, and periods of exuberance often result in sharp reversions. Again, it’s a contrarian indicator, and when optimism is too bullish, the ramifications are often bearish.
Furthermore, while the recent optimism (greed) has been driven by the belief that inflation will fall linearly and the Fed will pivot soon, the fundamentals contrast this narrative. Visa – the largest U.S. credit card issuer – released its first-quarter earnings on Jan. 26. CFO Vasant Prabhu said during the Q1 conference call:
“In total spend, it's remarkable stability. What's happening is as goods spending slowed down a bit, services spending really took up all the slack; and so, consumers have just shifted their spending but they're spending the same amount, and that's why debit has stayed resilient....
“Some people were worried that when things settle down, that debit might start to see some slowdown. But as you've seen, debit has stayed resilient even as credit has recovered, which has kept our overall payment volumes very stable.”
Please see below:
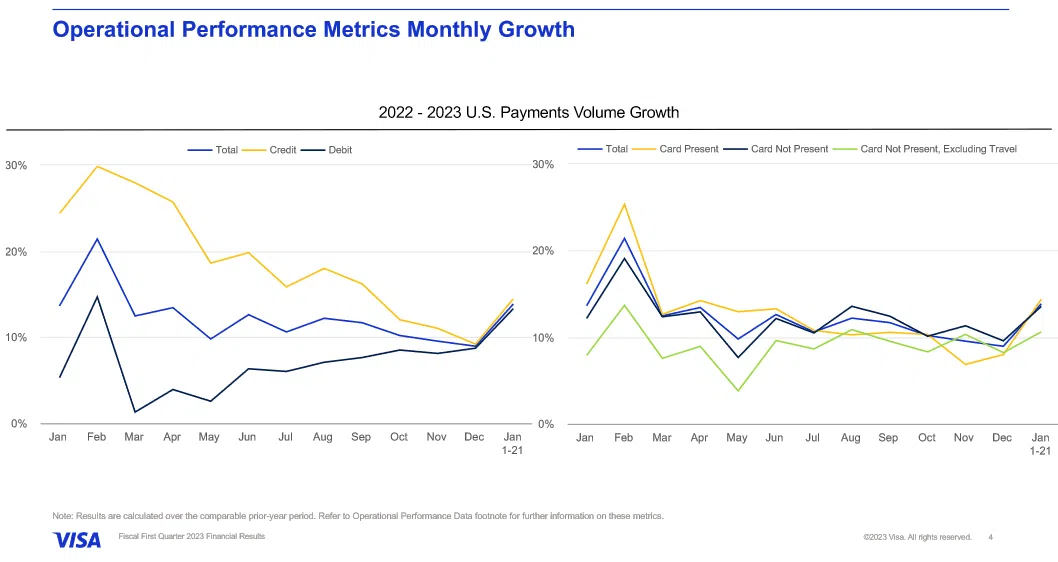
To explain, the yellow and dark blue lines on the left chart above track the payment volume growth of Visa’s credit and debit customers. If you analyze the performance, you can see that positive YoY growth was present throughout 2022 and that the dark blue line has been in an uptrend since March.
Therefore, while the crowd assumed (and still does) that Americans would run out of cash, Prabhu noted that “debit has stayed resilient even as credit has recovered.” Moreover, we warned this would occur throughout 2022 and wrote on Dec. 13:
While the FFR has surged in 2022 and the crowd still assumes that demand will collapse, the Fed revealed on Dec. 9 that U.S. households have a record ~$4.95 trillion (as of Q3 2022) in their checking and/or demand deposit accounts, which is 379% more than Q4 2019 and 6.3% more than Q2 2022.
Please see below:
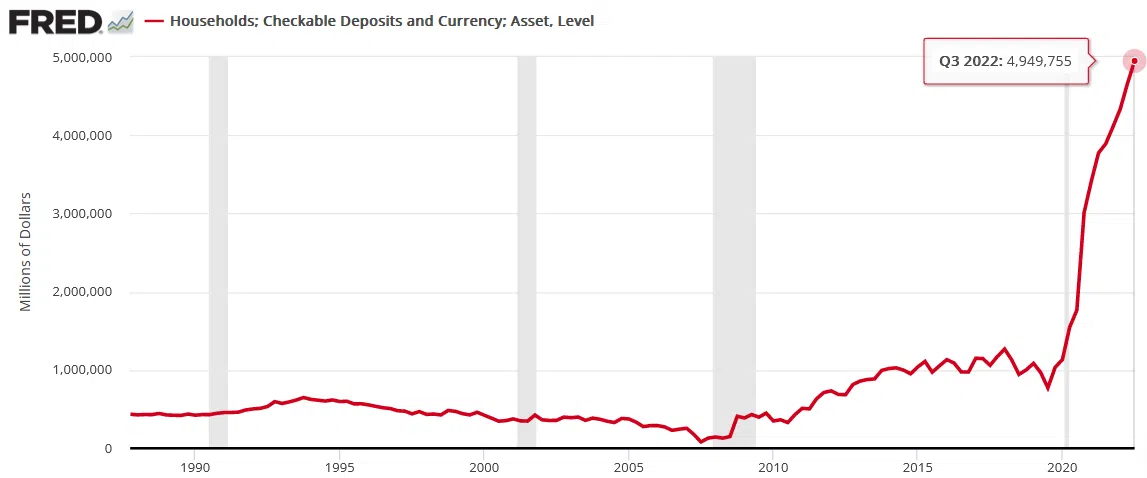
While investors wait for a destitute consumer to reduce inflation and allow the Fed to pivot, the vertical ascent on the right side of the chart above highlights the profound stimulus imbalance that materialized during the pandemic; and with wage growth also near an all-time high, investors are kidding themselves if they think monetary policy can return to its pre-pandemic state when Americans’ checking account balances have gone parabolic.
So, the fundamentals continue to align with our expectations, and the resiliency of consumer demand highlights why the FFR needs to rise much more than expected. As such, if rate-hike expectations rise to new highs, it could be a long way down before silver finds fundamental support.
Continuing the theme, Levi Strauss & Co. – the top denim brand in the U.S. – released its fourth-quarter earnings on Jan. 25. CEO Chip Bergh said during the Q4 conference call:
“Let me just talk to the pricing power of the brand. One of my favorite sayings is, you know a brand has good brand strength when you don't have to hold the prayer meeting to take pricing. We've taken pricing over the last 18 months to 24 months. Our AURs were up 6% for the year and that was driven fundamentally by pricing.”
He added:
“In the U.S., our DTC business broke a Q4 record with mainline and outlet stores and e-commerce each delivering record revenue. We continue to see strong momentum in traffic across our fleet, as well as strength in AURs, which increased high-single-digits versus last year.”
For context, DTC means direct-to-consumer (Levi’s online store), while AUR stands for average unit retail (measures the average selling price of Levi’s products); and with Bergh noting that AURs were up by 6% to high-single-digits alongside record DTC revenue, these are not the kind of results that create dovish pivots or 2% inflation.
Overall, investors remain in la-la land, so asset prices have not corrected much from their recent highs. But, with the fundamentals continuing to diverge from the narrative, it’s likely only a matter of time before reality returns. As a result, we believe that the silver price has much more downside than upside potential in the months ahead.
Will greed catch up to the bulls in the days and weeks ahead? How can inflation hit 2% if S&P 500 companies still see resilient demand? What are the odds of a pivot in mid-2023?
Alex Demolitor
Precious Metals Strategist