This in-depth analysis is normally reserved to Silver Catalyst subscribers, but today I’m making it available to you free of charge.
I hope, and trust that you’ll find it valuable.
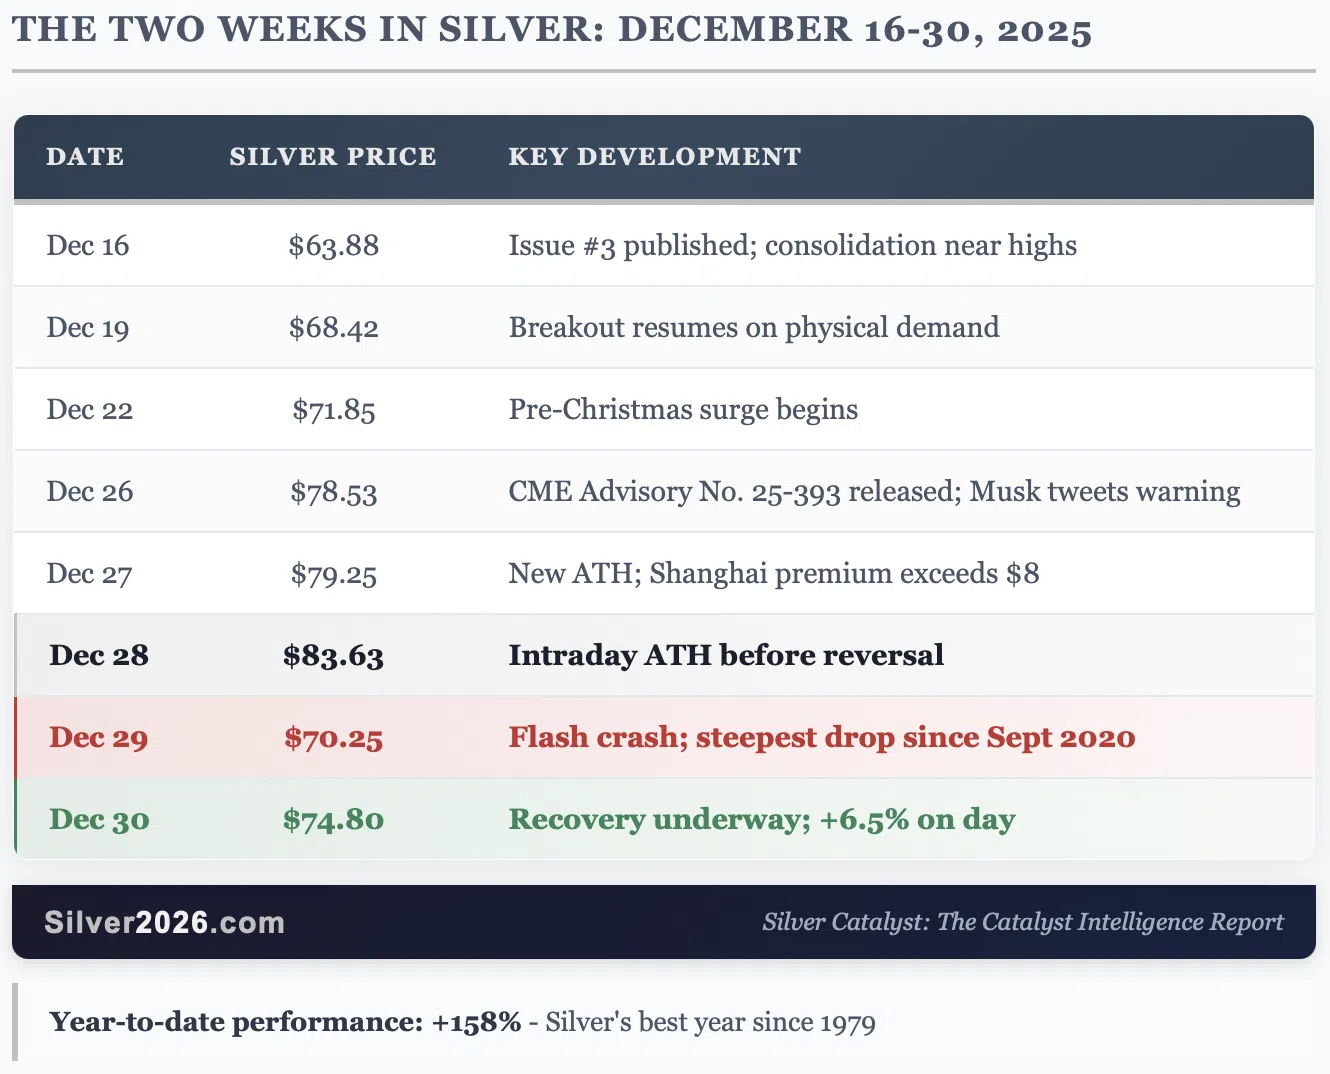
Welcome to the fourth and final issue of Silver Catalyst for 2025. What a year it has been. When I published Issue #3 on December 16, silver was consolidating around $63-64 after its historic run past $60. In the two weeks since, we've witnessed the metal surge to an all-time high of $83.63, crash 11% in a single session as the CME hiked margins, and recovered to trade around $77 as I write these words.
Congratulations. If you've been positioned in silver throughout 2025, you've participated in the best year for the metal since 1979. A 158% gain. From $29 to $75. From a gold-silver ratio of ~90:1 to ~64:1. From institutional indifference to Elon Musk tweeting warnings about supply constraints. The thesis from the book is playing out in a near-perfect manner.
And we're just getting started. China's export restrictions take effect in 48 hours. The structural deficit continues. The catalysts keep converging.
I'm offering a Year-End Special: $299 for all of 2026 (significant savings vs. monthly). Given what silver price has been doing and how exciting the New Year is likely to be for silver investors, it seems that securing coverage for the year is a good move. Especially that you have the ability to do it with a $90+ discount. This is available only until midnight, Dec 31 - so it I suggest that you upgrade and secure the discount right away. The ‘Silver Rising’ book (333 pages, 100 catalysts) is included.
Having said that, let's dig into the most dramatic week in silver market history.
The Week That Changed Everything
In the span of just 72 hours, the silver market experienced:
- A surge to an all-time high of $83.63
- The largest single-day crash in over five years (-11%)
- CME margin hikes drawing comparisons to "Silver Thursday" 1980
- Elon Musk publicly warning about silver supply risks
- China's export restrictions taking effect in 48 hours
If you're feeling whiplash, you're not alone. But here's what matters: the fundamentals of driving silver's 158% annual gain remain completely intact. The paper market may have buckled under regulatory pressure, but physical reality hasn't changed one ounce.
This issue goes deeper than usual. I'm going to quantify exactly what's happening in millions of ounces, because that's what the engineering approach demands. The numbers tell a story that price action alone cannot.
Deep Dive #1: The Structural Deficit Problem
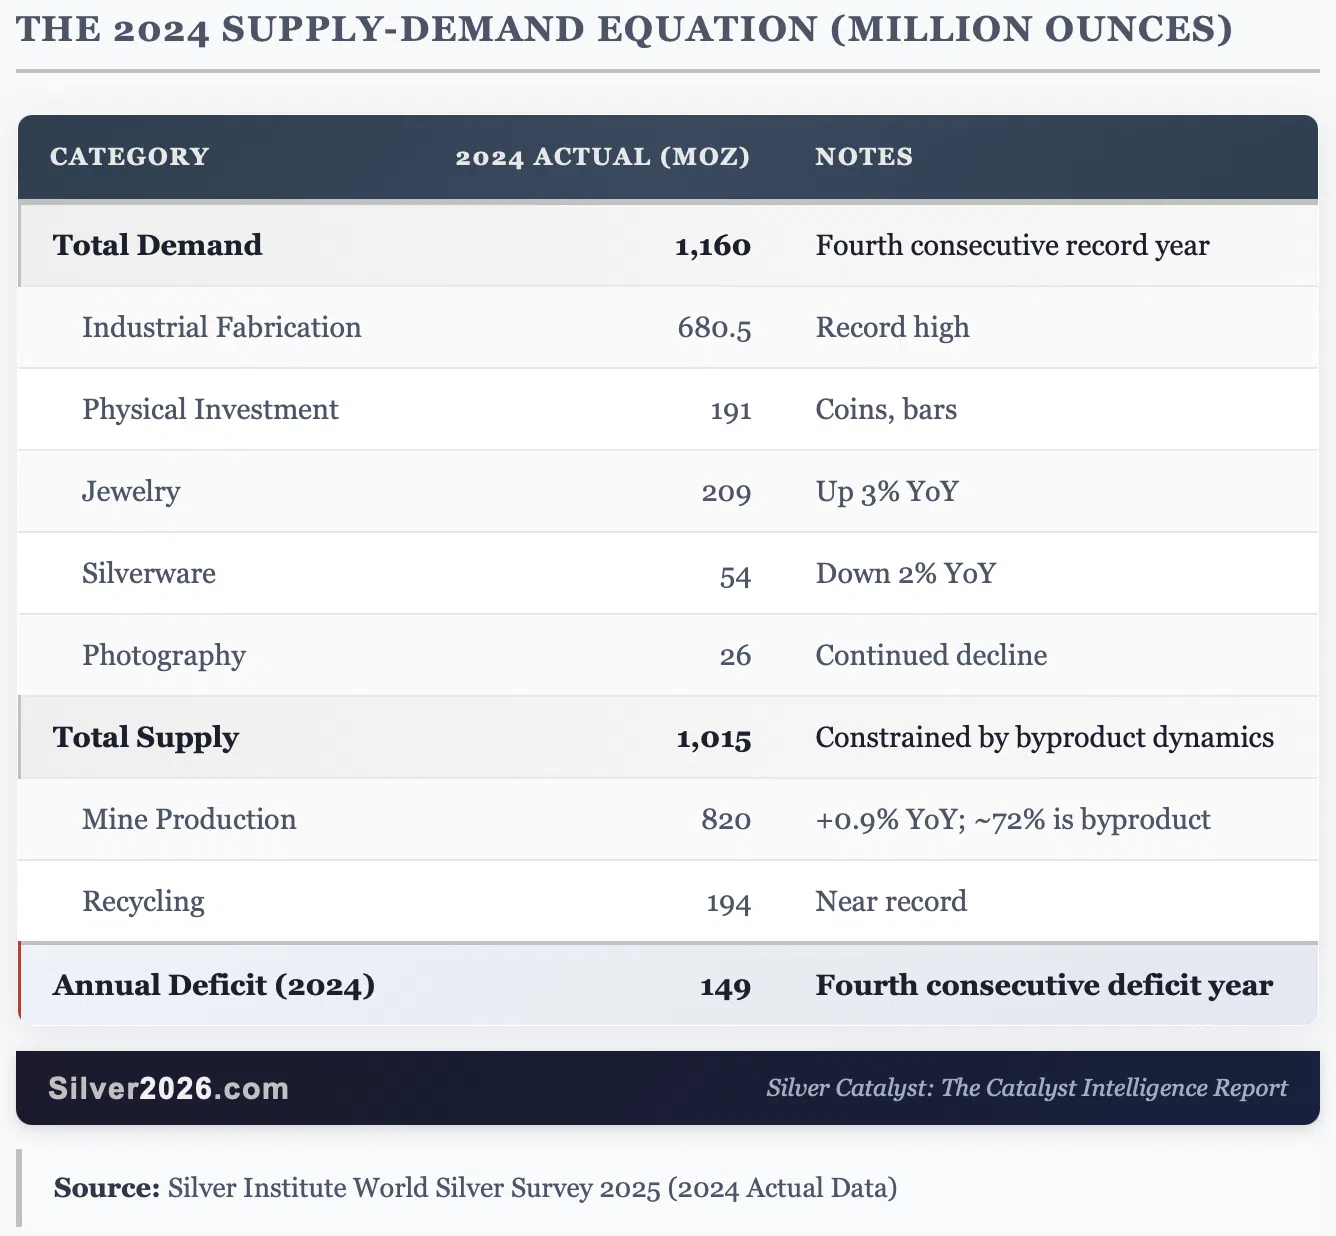
Before we discuss the week's events, let me put the structural situation in perspective with hard numbers. Note: The figures below are based on the World Silver Survey 2025 published in April 2025. They represent 2024 actual data where noted and 2025 estimates, which may be revised as final year-end data becomes available.
The Supply-Demand Equation
The Cumulative Drain
The 2024 deficit isn't an isolated event. Here's what's happened to global silver inventories since the structural deficit began:
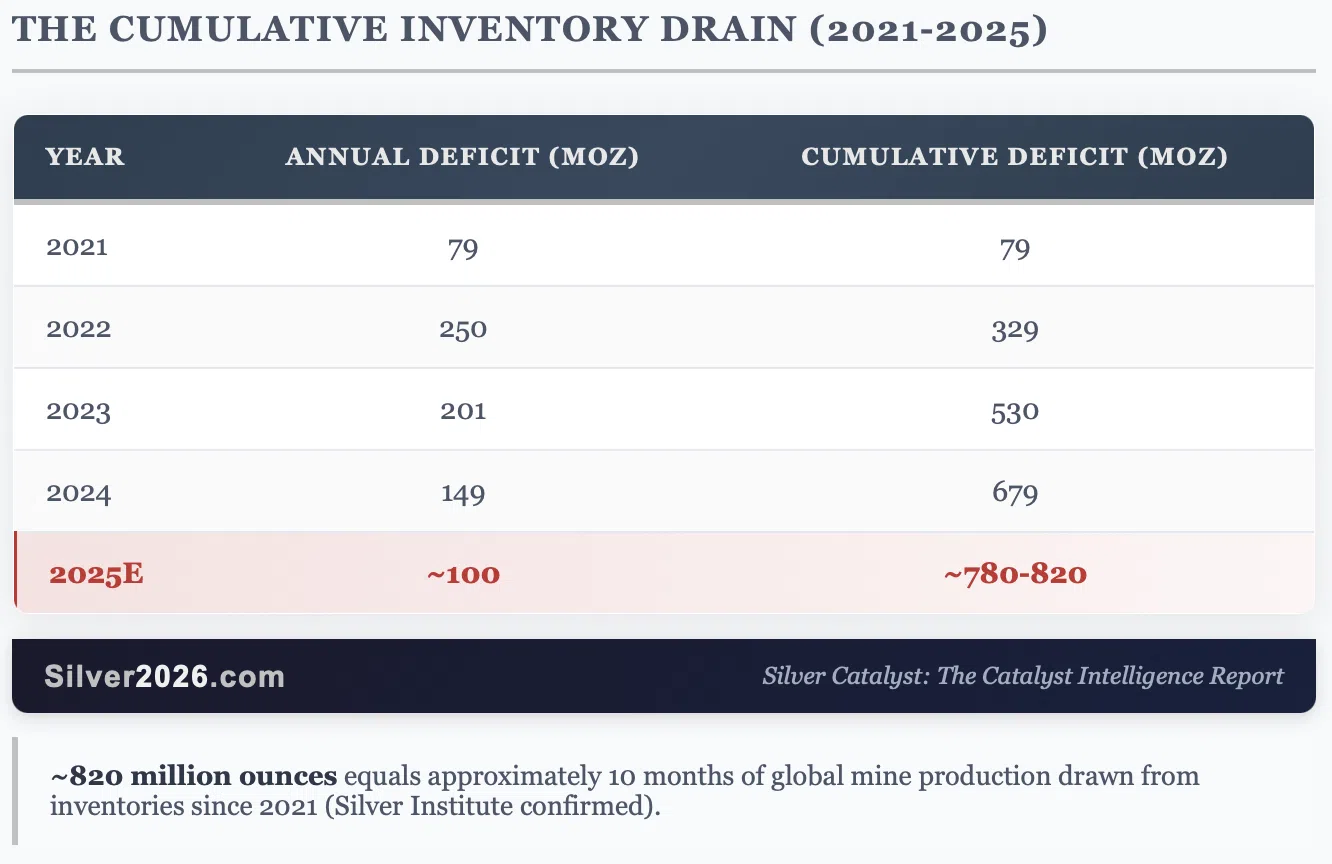
Almost 820 million ounces over five years. The Silver Institute confirmed this figure in their November 2025 report. That's equivalent to nearly a full year of global mine production that has been drawn from inventories to meet demand. Where did it go? Into solar panels. Into electric vehicles. Into smartphones and servers. Into uses where it cannot be economically recovered.
This is why COMEX registered inventories are down 70% since 2020. This is why Shanghai inventories sit at decade lows.
Catalyst Connection: This directly validates Catalyst #2: COMEX Inventory Depletion and demonstrates why the situation is not temporary.
Deep Dive #2: The CME Intervention and Historical Context
What Happened
On December 26, the CME Group released Advisory No. 25-393, announcing its second margin hike in two weeks:
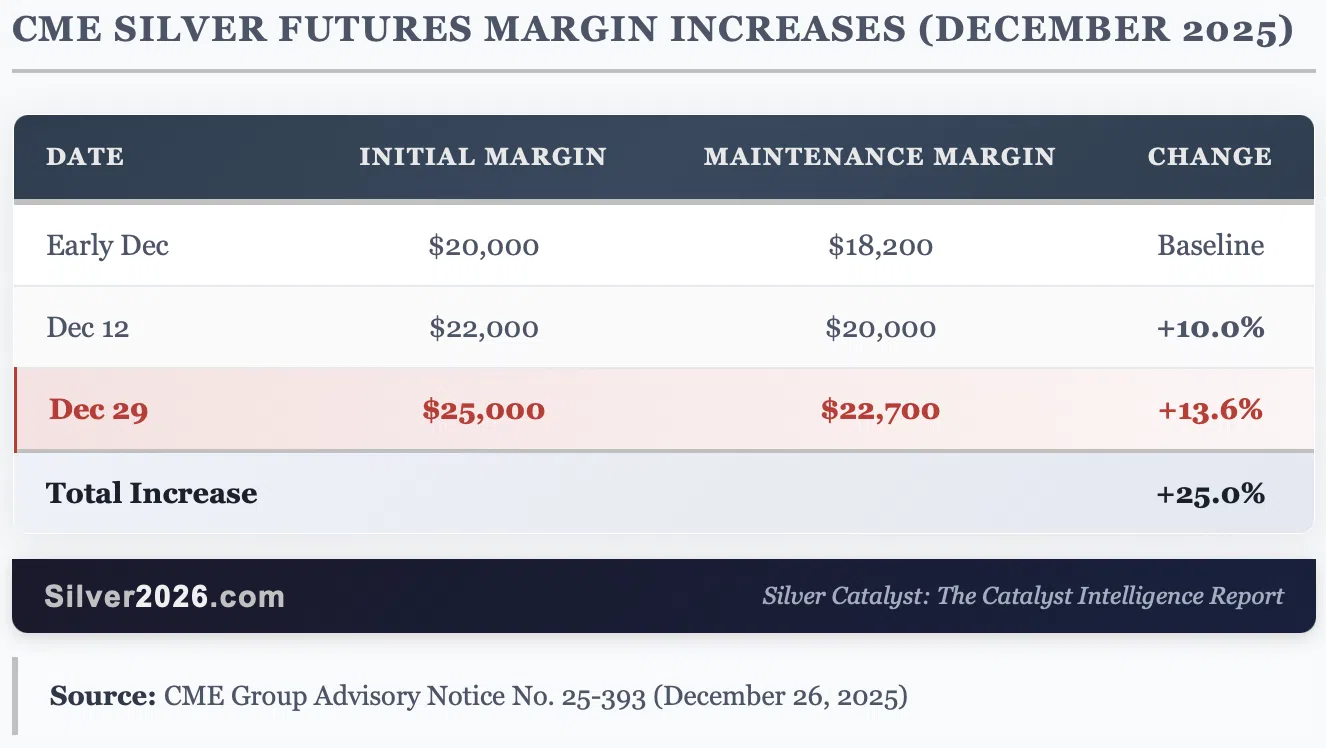
When markets opened Sunday night, the effect was immediate and brutal. Leveraged long positions were liquidated en masse. Silver plunged from its $83.63 peak to $70.25, an 11% intraday collapse that ranks among the largest price reversals in silver history.
Why This Matters: The Paper-Physical Divergence
Here's what the margin hikes revealed: the paper market and physical market are now operating on different planes of reality.
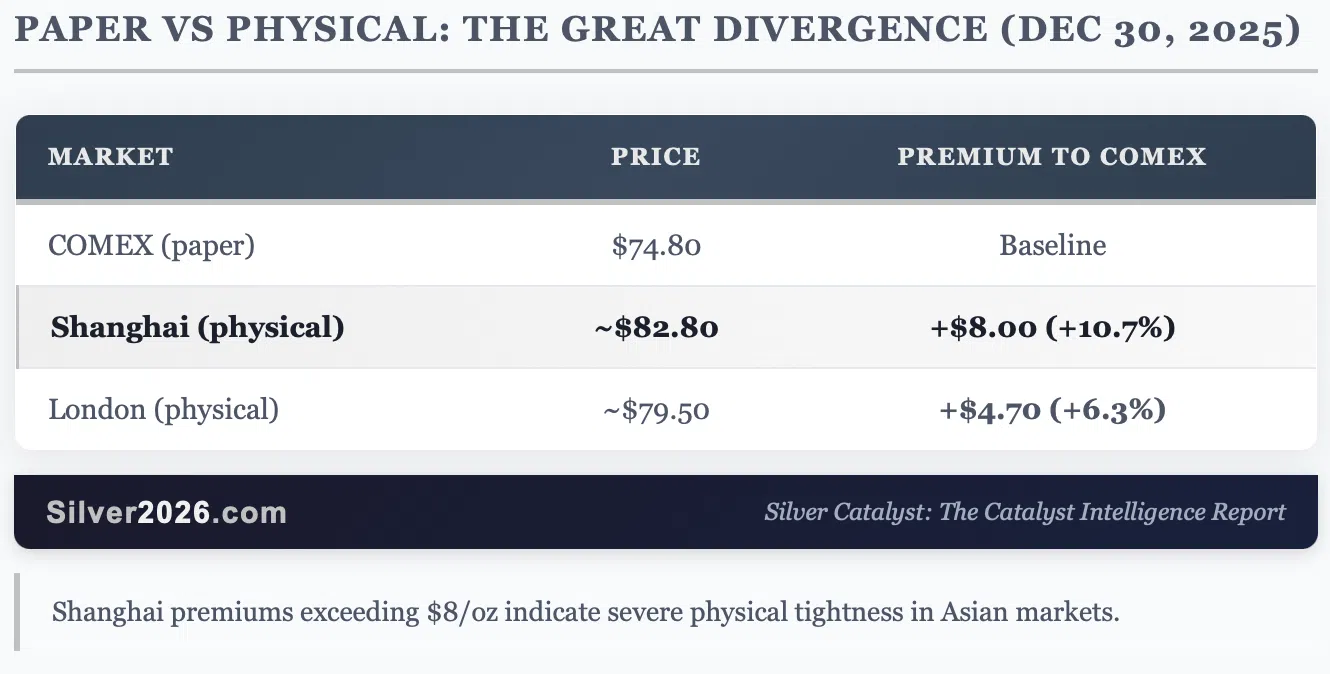
When Shanghai silver trades at an $8+ premium to COMEX, it tells you that physical buyers in Asia are willing to pay substantially more than the futures price to secure actual metal. This is not normal. In a functioning market, arbitrage would close that gap within hours, or at least it wouldn't be as big.
The gap persists because there isn't enough physical silver available to arbitrage. The paper market can create unlimited contracts. The physical market cannot create unlimited metal.
The Historical Parallel Everyone Is Talking About
The phrase "Silver Thursday" has dominated financial headlines this week, referencing March 27, 1980, when the CME (then COMEX) introduced "Silver Rule 7" to force the Hunt Brothers into liquidation. That intervention triggered a 50% price collapse over the following months.
The 2011 silver peak offers a more recent precedent. When silver surged from $8.50 to nearly $50, the CME raised margins five times in just nine days, causing a 30% collapse in weeks.
Why 2025 Is Fundamentally Different
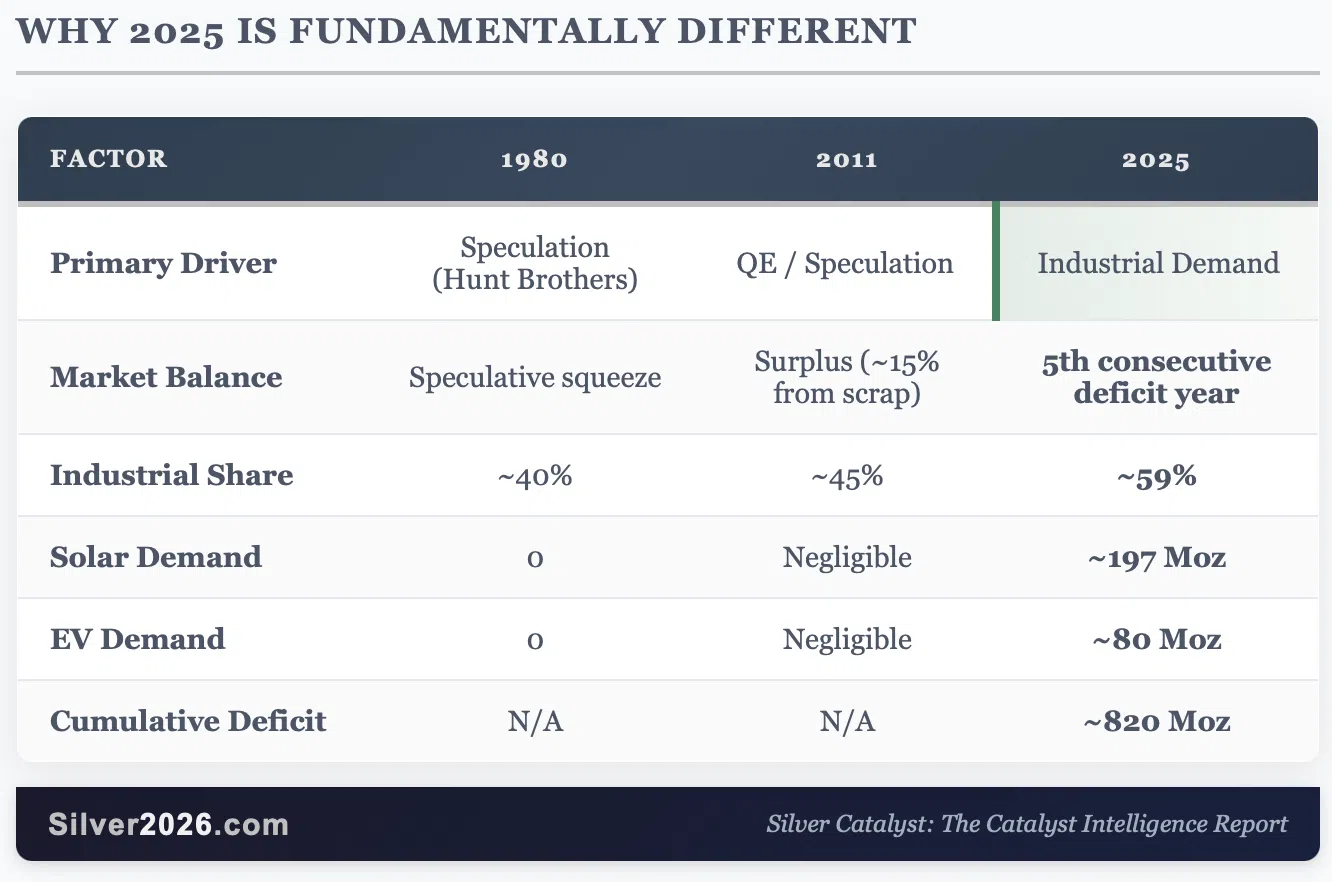
The critical difference? In 1980, the Hunt Brothers attempted to corner the market, creating an artificial squeeze that collapsed when regulators intervened. In 2011, high prices triggered massive scrap recycling, creating a surplus that undermined the rally. Both price spikes were driven by speculation, not fundamentals. In 2025, industrial demand is consuming silver faster than it can be mined and has been for five consecutive years. This is a structural shift, not speculative excess.
Silver could slide as it did previously (in fact, it’s likely in my view, but my timing analysis is the focus of and goes beyond the scope of this publication), but the correction might only be short-lived this time as the physical demand overwhelms the market at lower prices. And I don’t mean just the investment demand but purchases from industrial users that might view this as an opportunity to secure their silver while they still can.
The margin hikes address speculative excess in the paper market. They do nothing to address the physical deficit, the depleting COMEX inventories, or China's export restrictions taking effect in 48 hours.
Catalyst Connection: This directly validates Catalyst #56: Futures Market Structure Stress Indicators and Catalyst #48: Paper-Physical Ratio Divergence. The paper market is breaking down precisely as the FORCE Framework predicted.
Deep Dive #3: China's Export Restrictions - Quantifying the Impact on Western Markets
In 48 hours, China's silver export licensing requirements take effect. Let me quantify exactly what this means for markets outside China.
The Policy Details
Effective Date: January 1, 2026
Requirements for Export License:
- Minimum annual production capacity: 80 tonnes (2.57 million ounces)
- Minimum credit facility: $30 million USD
- State approval from Ministry of Commerce (MOFCOM)
Impact: Only large, state-aligned producers qualify. Hundreds of small and mid-sized exporters, who collectively account for a significant portion of China's silver exports, are effectively blocked.
Source: China Ministry of Commerce (MOFCOM) announcement, October 30, 2025
Why China's Position Matters for Western Markets
China controls an estimated 60-70% of global refined silver supply. This dominance comes from two sources:
- Domestic mining: China is the world's #2 silver producer (3,300 metric tonnes in 2024, behind only Mexico's 6,300 tonnes)
- Refining capacity: China processes silver concentrates from mines worldwide, acting as a refining hub for global production
When China restricts exports, it doesn't just affect Chinese-mined silver. It affects silver refined in China from ore mined in Australia, Peru, and elsewhere. For Western industrial users, electronics manufacturers, and solar panel producers, this creates an immediate supply constraint.
The Math: Deficit Impact Scenarios
The current global deficit is approximately 100-150 million ounces annually. Here's what happens under different scenarios:
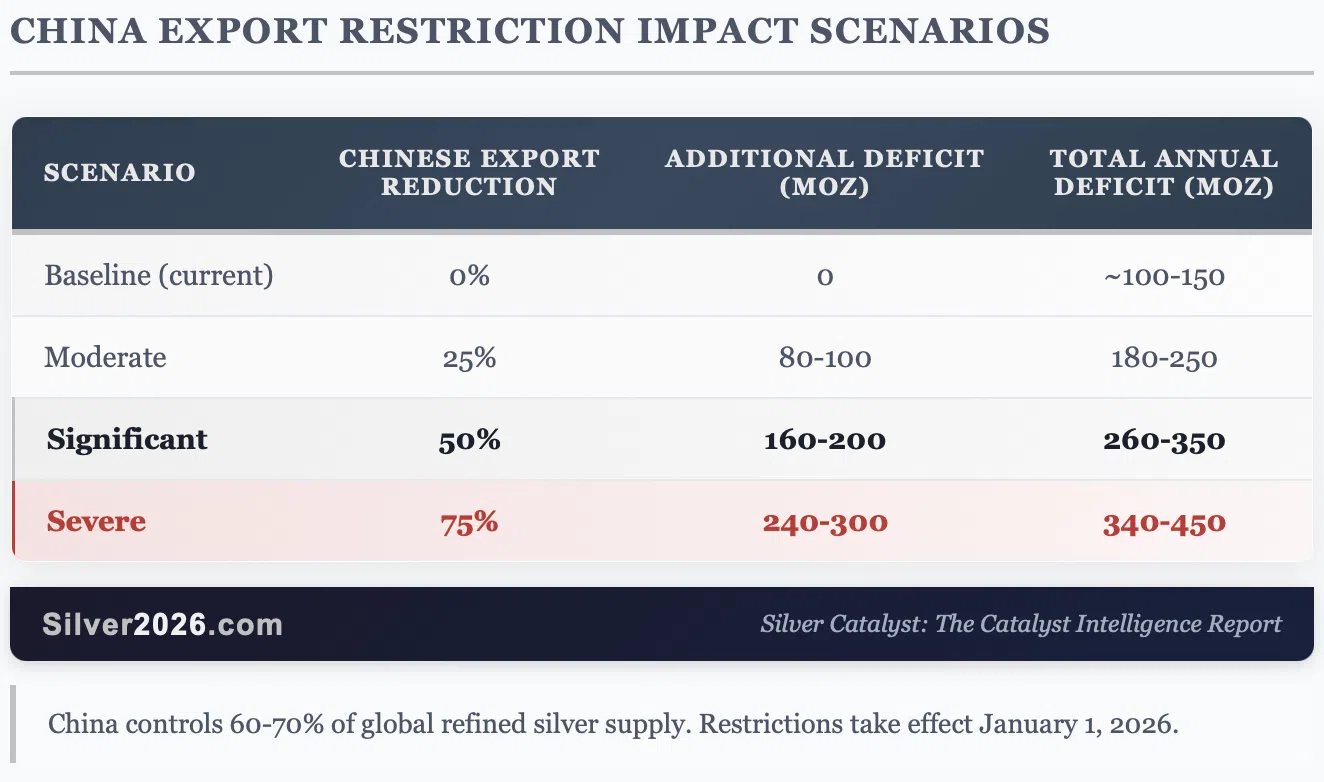
Analysts project that if Chinese exports drop by 50%, annual deficits could exceed 5,000 metric tonnes (~160 million additional ounces), compounding the existing structural shortfall and accelerating inventory depletion.
Source: AInvest Analysis
The Strategic Context
This mirrors China's playbook with other strategic materials:
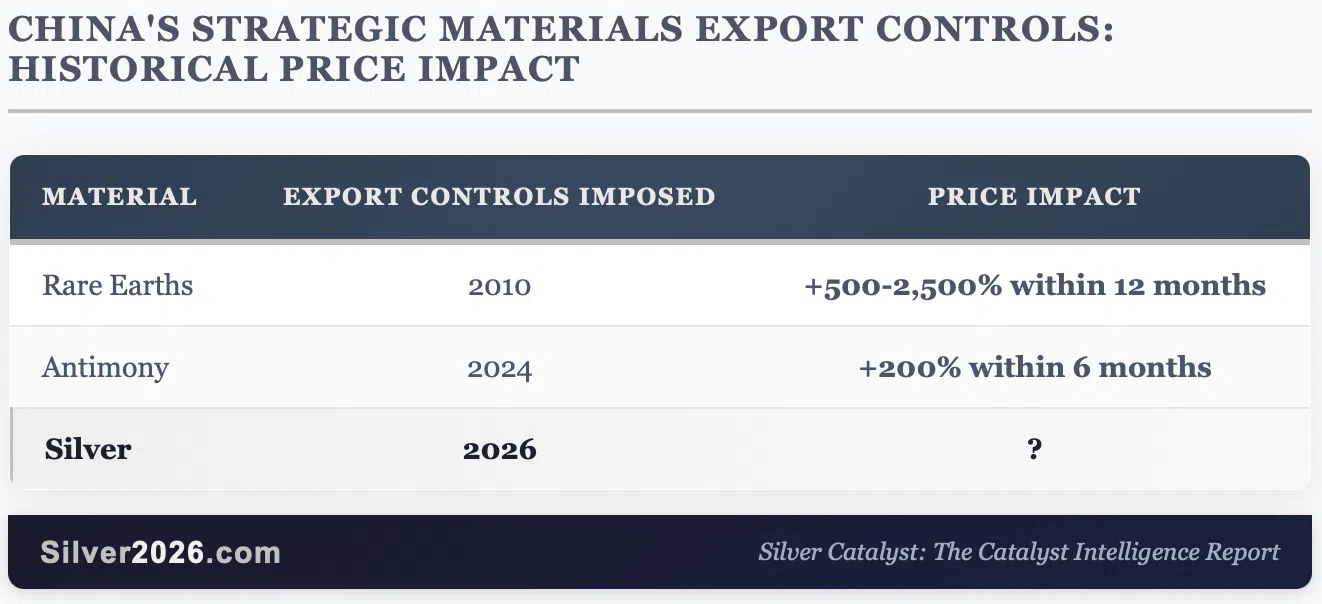
China isn't restricting silver exports because it has too much. It's restricting exports because it needs the metal for its own solar panel manufacturing, EV production, and electronics industry. Domestic consumption is the priority.
Catalyst Connection: This is the real-time activation of Catalyst #12: Resource Nationalism Wave Restricting Exports. When I wrote in "Silver Rising" that resource nationalism was accelerating globally, this is exactly what I meant.
Deep Dive #4: The Musk Factor - When the World's Richest Man Sounds the Alarm
On December 27, Elon Musk responded to news of China's silver export restrictions with nine words:
"This is not good. Silver is needed in many industrial processes."
Source: X.com
Why This Matters: Quantifying Musk's Silver Exposure
Musk isn't a silver bug or precious metals investor. He's a significant industrial consumer of silver through his companies. Let me quantify his exposure:
Tesla:
- 2025 estimated production: ~1.6 million vehicles
- Silver per BEV: 25-50 grams (0.8-1.6 troy oz)
- Annual silver consumption: ~1.3-2.6 million ounces
SpaceX:
- Silver used in electrical systems, solar arrays, thermal management
- Each Starlink satellite contains silver in electronics
- ~8,600 satellites currently operating, thousands more planned
SolarCity/Tesla Energy:
- Solar panels: ~20 grams silver per panel
- Powerwall/Megapack: Silver in electronics and connections
- Growing rapidly as energy storage demand explodes
xAI/AI Infrastructure:
- Data centers require silver in servers, connections, cooling
- Each enterprise server motherboard: 1-3 grams of silver
- AI infrastructure is silver-intensive
When Musk says silver supply constraints are "not good," he's speaking as someone whose multi-hundred-billion-dollar industrial empire depends on reliable silver supply. This is perhaps the most significant mainstream validation of the silver thesis in decades.
Source: Elon Musk's X post, December 27, 2025
Catalyst Connection: This validates Catalyst #46: Silver's Irreplaceable Technology Properties and Catalyst #47: Technology Substitution Challenges Despite Industry Efforts.
Deep Dive #5: The Wild Card Nobody Is Talking About - Samsung's Silver Solid-State Battery
While everyone focuses on solar and EVs, there's a potential demand catalyst that could dwarf everything else: Samsung's all-solid-state battery (ASSB) technology.
The Technology
Samsung's ASSB uses a silver-carbon (Ag-C) composite layer as the anode. This isn't theoretical; the technology was first detailed in a 2020 Nature Energy paper and has been in active development since.
Source: Samsung Newsroom
The Specifications
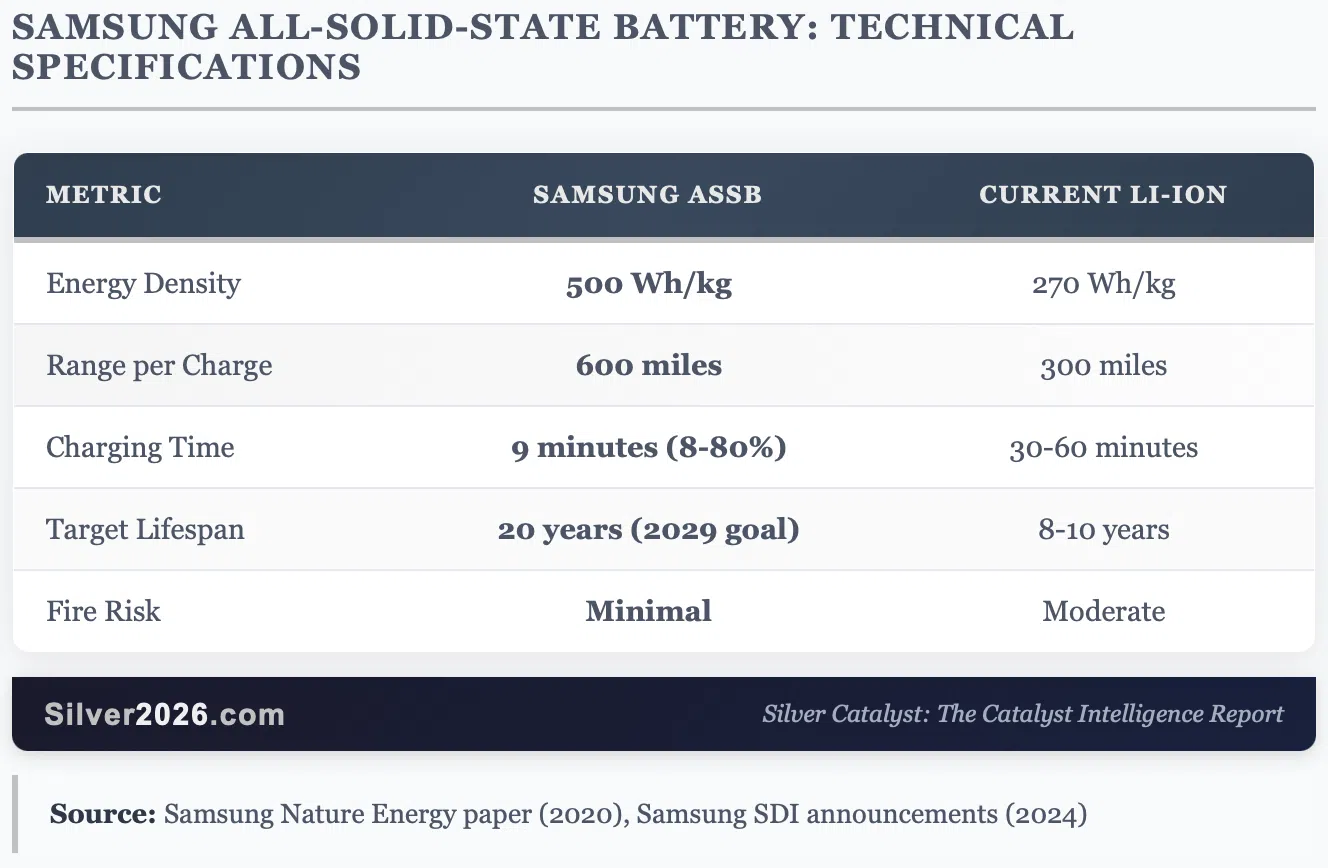
The Silver Requirement - This Is Where It Gets Serious
Important disclosure: The specific silver content figures below come from industry analysis articles, not directly from Samsung's scientific publications or press releases. The 2020 Nature Energy paper confirms the silver-carbon composite anode technology but does not specify exact silver quantities per cell. That said, the estimates appear reasonable given the technology's requirements, and I present them as plausible projections rather than confirmed specifications.
Industry analysts estimate that each Samsung ASSB cell contains approximately 5 grams of silver in the Ag-C composite anode.
A typical EV battery pack contains approximately 200 cells, which means:
Estimated silver per vehicle: ~1 kilogram (32 troy ounces)
Compare this to current EVs, which use only 25-50 grams (0.8-1.6 oz) of silver, mostly in electronics rather than the battery itself.
Source: INDmoney Industry Analysis
The Demand Math - Scenario Analysis
Global vehicle production is approximately 80 million units annually. Let me model different adoption scenarios:
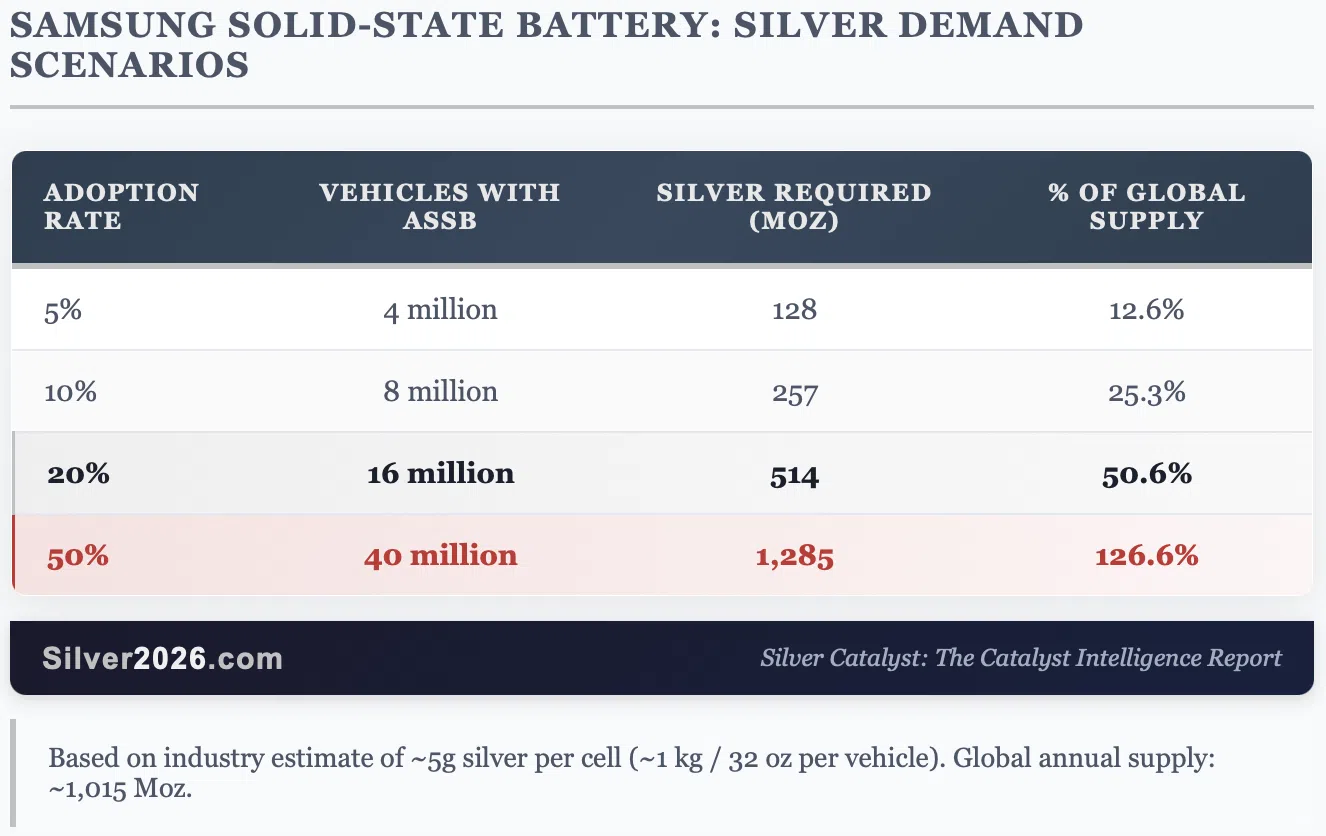
For context, total global silver supply is approximately 1,015 million ounces.
Even at 20% adoption, Samsung's battery technology alone would consume more than half of global annual silver supply. At 50% adoption, it would require more silver than currently exists in annual production.
The Timeline
- 2020: Technology announced in Nature Energy
- 2024 Q3: Pilot production lines operational at Samsung SDI
- 2026 Late: First production vehicles expected (premium segment)
- 2027: Both Samsung SDI and Toyota targeting mass production independently
- 2030: Mass-market models expected
Note: While Samsung and Toyota have each announced 2027 mass production targets, they are developing solid-state batteries independently rather than as partners.
Source: Discovery Alert
Why This Is a "Wild Card"
I call this a wild card because the timeline and adoption rate are uncertain. Battery technology transitions don't happen overnight. But consider this:
- Samsung SDI has operational pilot lines
- The technology solves the two biggest problems with EVs: range anxiety and charging time
- Once consumers experience 600-mile range and 9-minute charging, demand for older technology will collapse
The silver market is not prepared for this scenario. Current industrial demand projections don't account for solid-state batteries because adoption is assumed to be minimal before 2030.
If Samsung executes faster than expected, we could see demand shocks of 100+ million ounces annually by the late 2020s.
Catalyst Connection: This technology is captured as Catalyst #80: Solid-State Batteries Requiring Enhanced Silver Content in the book. Given Samsung SDI's recent progress, I'm upgrading this catalyst: Price Impact to 5/5 (from 4/5) and Probability to 3/5 (from 2/5). The composite score increases from 8 to 15.
Deep Dive #6: Industrial Demand by Sector - The Numbers That Matter
Let me break down where silver is going and why substitution isn't happening.
Solar Photovoltaic: 197 Million Ounces and Growing
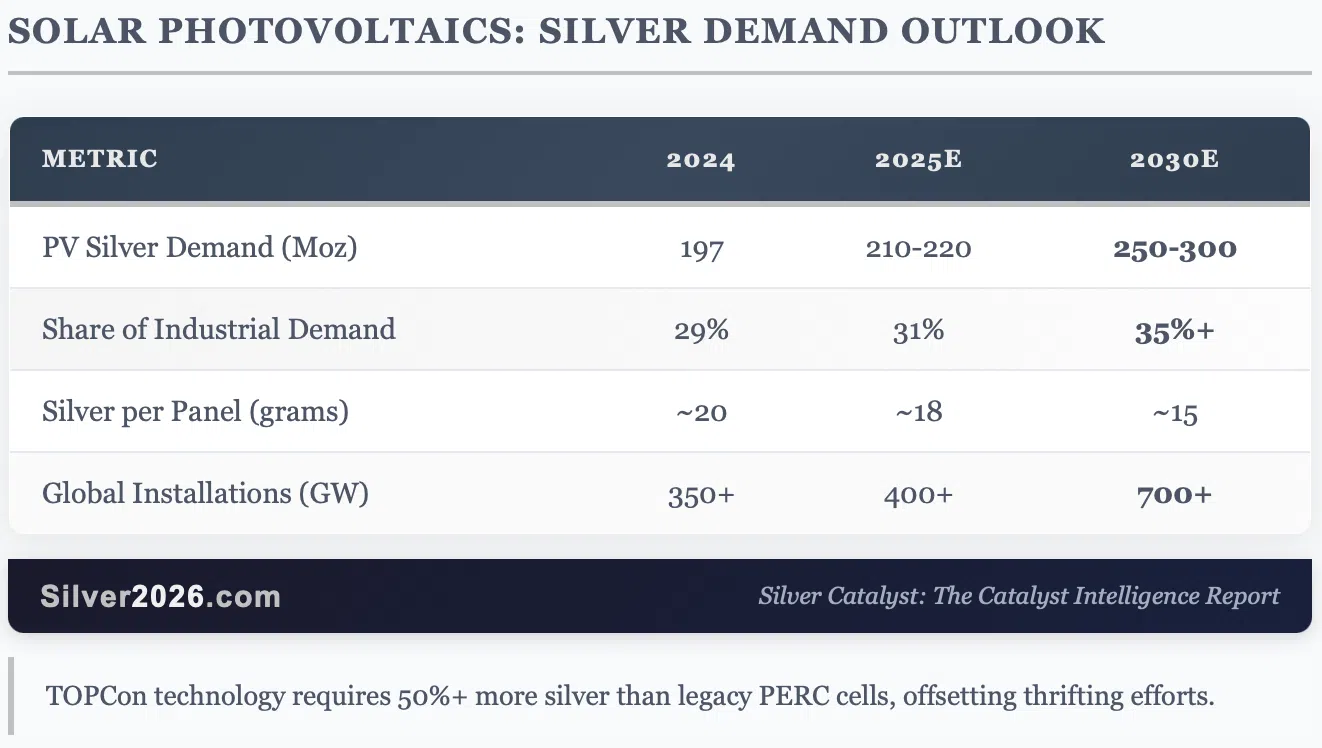
Key Development: TOPCon cells, which now exceed PERC cells in market share (2024), require 50% more silver than previous generation cells. While thrifting continues, the shift to higher-efficiency cells partially offsets silver reduction per watt.
The EU alone targets 700 GW of solar capacity by 2030. China continues aggressive solar buildout. The U.S. IRA subsidizes domestic solar manufacturing.
Source: Silver Institute - Next Generation Metal Report
Electric Vehicles: 80-90 Million Ounces and Accelerating
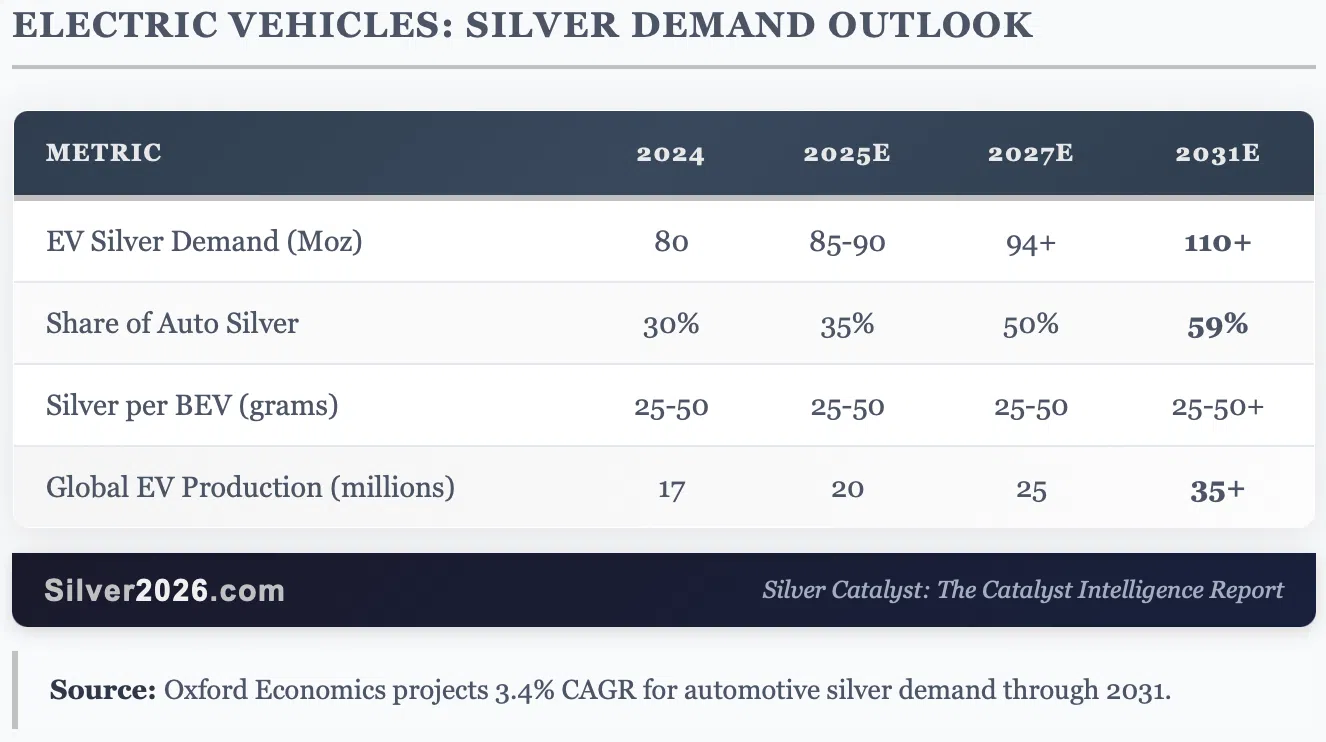
Key Development: EVs will overtake ICE vehicles as the primary source of automotive silver demand by 2027. The Oxford Economics report projects a 3.4% CAGR in automotive silver demand through 2031.
This does NOT include solid-state battery adoption, which would dramatically increase silver per vehicle.
Source: Silver Institute - Key Technology Sectors Report
AI & Data Centers: The Emerging Demand Category
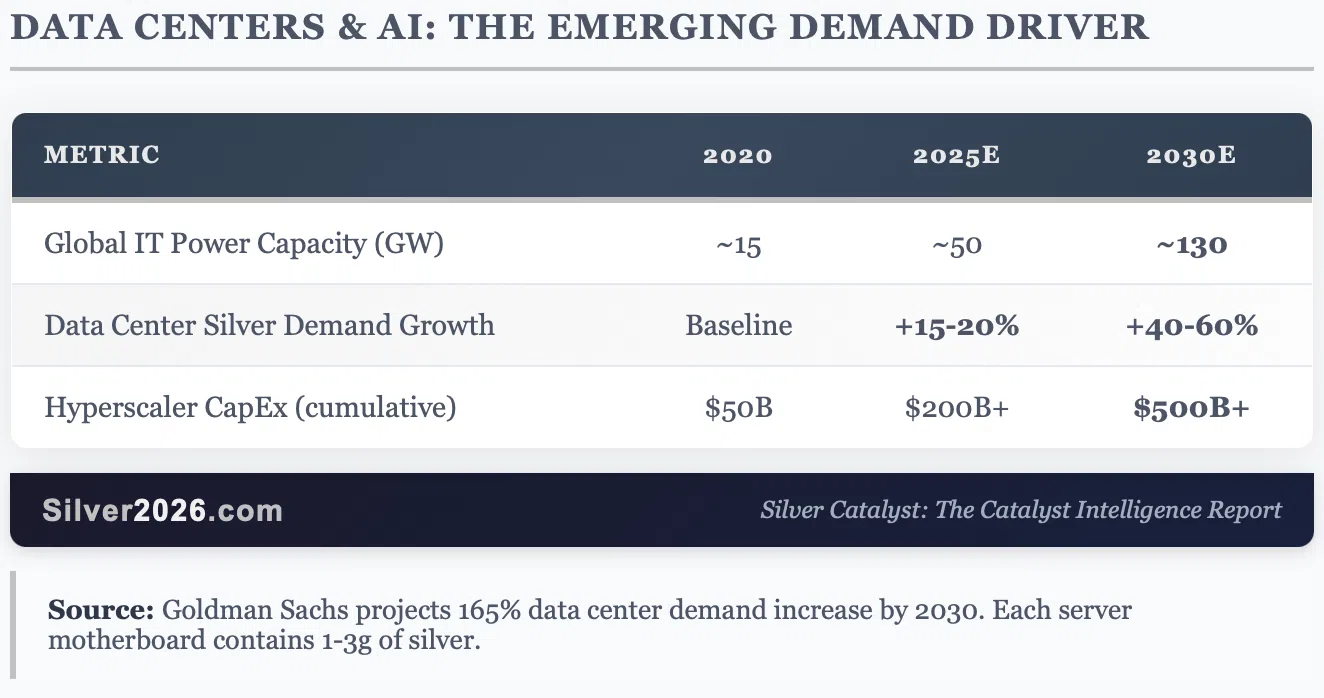
Key Development: Global IT power capacity has increased 53x since 2000 (0.93 GW to ~50 GW). Goldman Sachs projects data center power demand will rise 165% by 2030 as AI clusters deploy at unprecedented density.
Each enterprise server motherboard contains 2-5 grams of silver. A hyperscale data center contains thousands of servers. A single 500 MW solar array to power one data center requires approximately 300 metric tonnes (9.6 million ounces) of silver.
Microsoft, Google, Amazon, and Meta have collectively announced $200+ billion in data center spending through 2025, with more commitments expected.
Source: Smart Money Match Analysis
The Substitution Myth
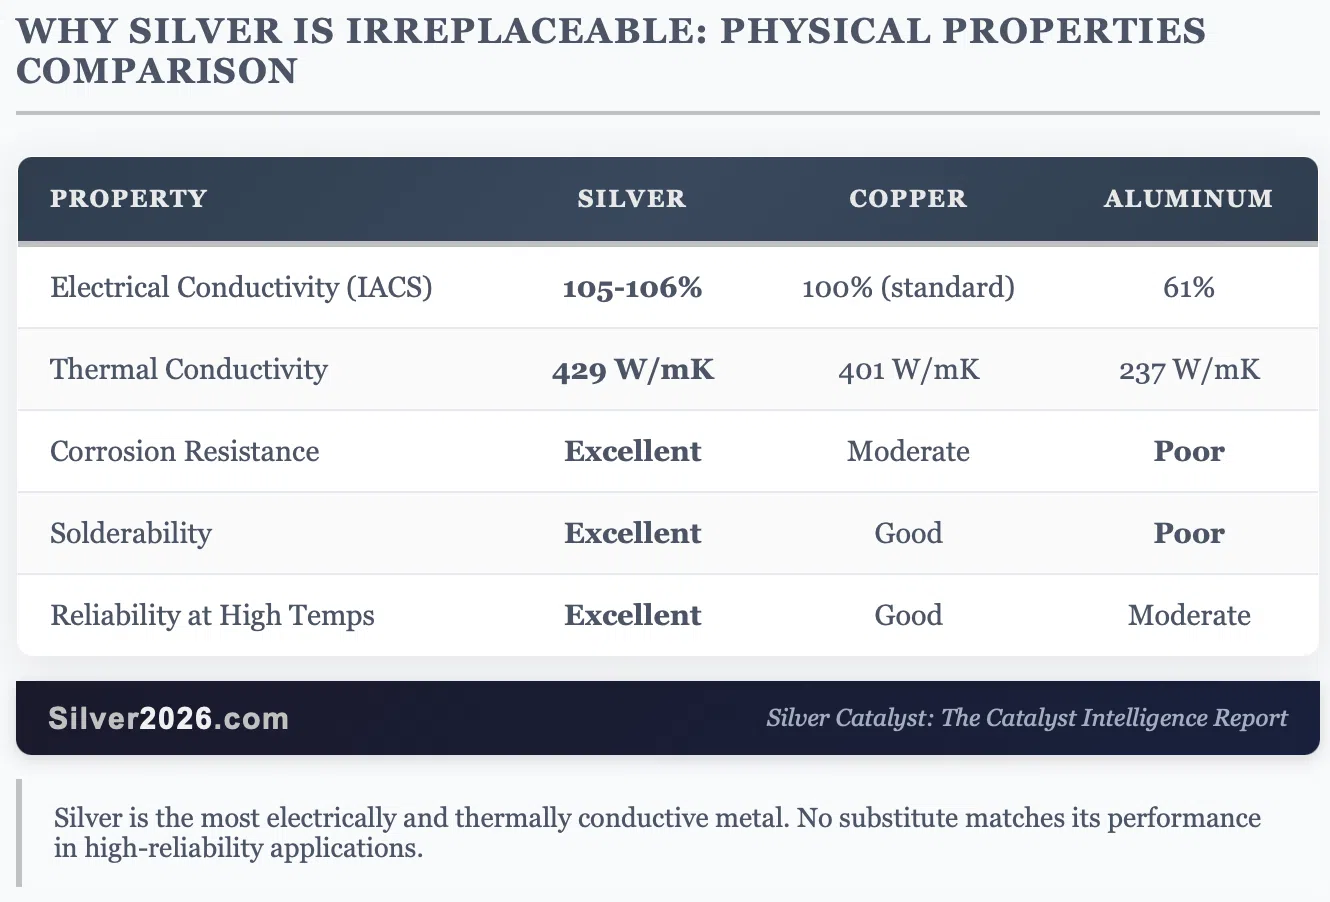
Why can't manufacturers just switch to copper? The answer is physics.
That 5-6% conductivity advantage matters enormously in high-efficiency applications. In solar cells, copper pastes have been tested for years but fail to match silver's performance in the thin layers required for efficient panel design.
In automotive and aerospace applications, reliability is paramount. A small efficiency loss might be acceptable. A reliability failure is not.
The critical question: Yes, some substitution will occur, and thrifting (using less silver per unit) continues. But will the substitution rate manage to keep up with the explosion of new silver-intensive applications? Solar demand didn't exist two decades ago. EVs were a curiosity. Data centers were small. Samsung's solid-state battery was science fiction. The rate at which new silver applications emerge appears to be outpacing the rate of substitution, and this dynamic shows no signs of reversing.
Source: GR Reserve - Industrial Uses Guide
The Gold-Silver Ratio: Historic Compression
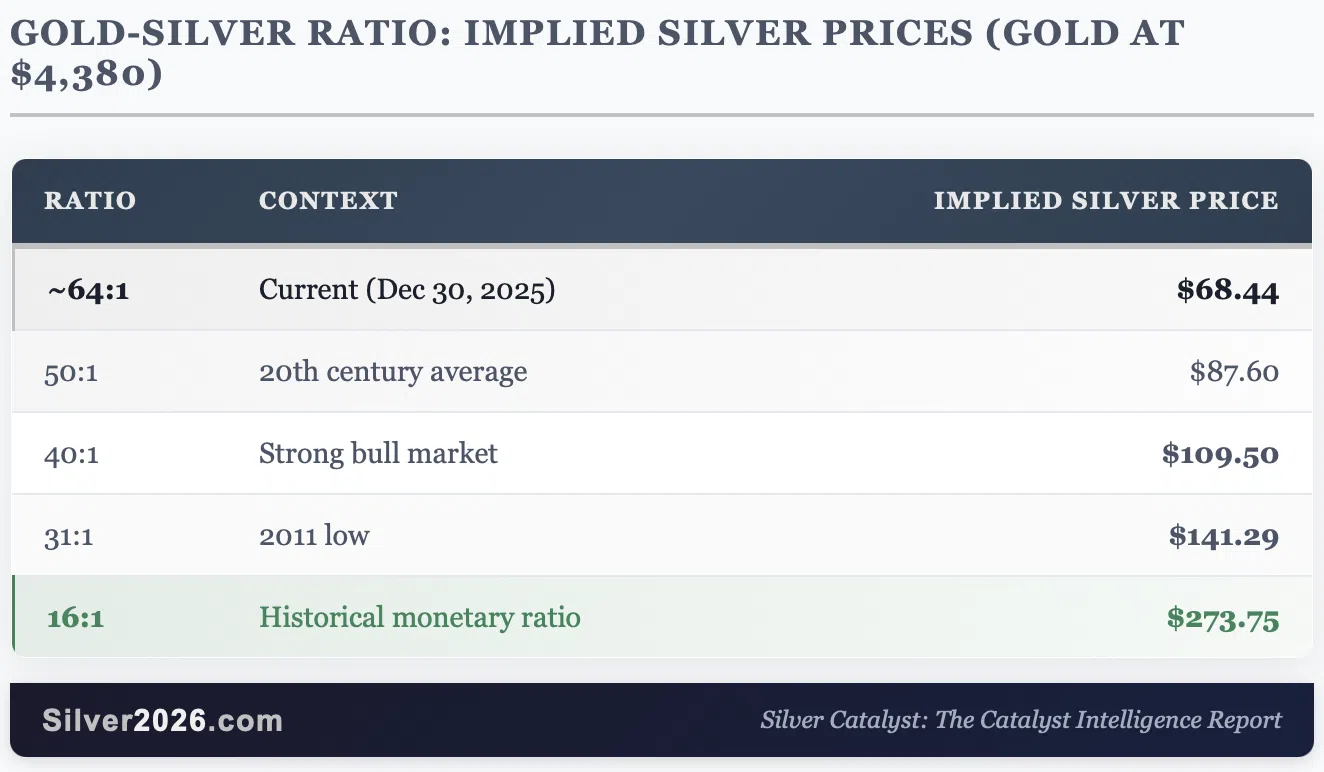
The gold-silver ratio has compressed from approximately 90:1 in early 2025 to around 64:1 today. This is approaching the "50:1 rule" that historically signals silver is fairly valued relative to gold.
However, given silver's industrial demand profile and structural supply constraints, I think the ratio has room to compress further. At 50:1 with gold at current levels, silver would be $87.60. At 40:1, silver would exceed $109.
Catalyst Connection: Catalyst #50: Gold-Silver Ratio at 87-100:1 vs. 47-50:1 Historical Average is playing out in real-time.
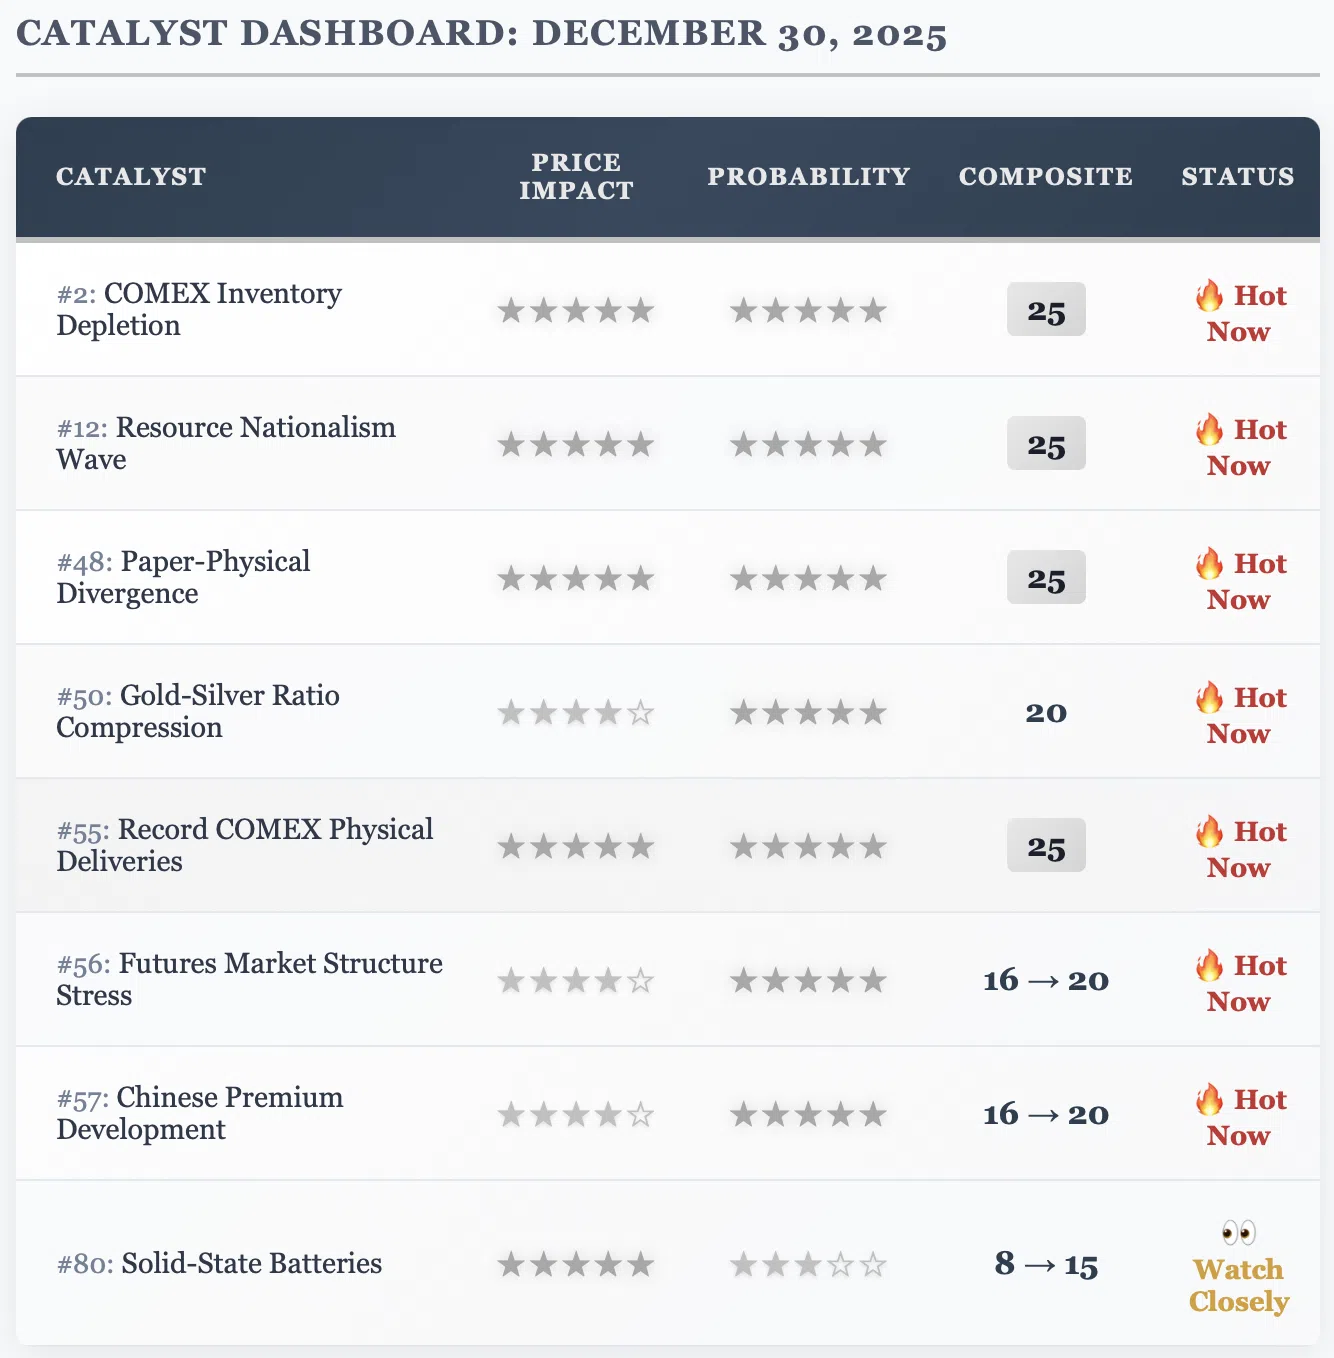
Catalyst Dashboard: December 30, 2025
Catalyst Updates This Issue
#12: Resource Nationalism Wave - Now "Hot Now" status. Price Impact upgraded to 5/5 stars given China's export restrictions. Probability already at 5/5. China's export licensing requirements are no longer theoretical; they take effect January 1. The composite score increases to 25.
#56: Futures Market Structure Stress - Now "Hot Now" status. Probability upgraded from 4/5 to 5/5 stars. The CME's margin hikes and the resulting flash crash demonstrate that paper market stress has reached critical levels. The composite score increases from 16 to 20.
#57: Chinese Premium Development - Now "Hot Now" status. Price Impact upgraded from 3/5 to 4/5 stars. Shanghai premiums of $8+ over COMEX prices confirm the "Great Divergence" is well underway. The composite score increases from 16 to 20.
#80: Solid-State Batteries - Now "Watch Closely" status. Samsung SDI's operational pilot lines and confirmed 2027 mass production timeline warrant upgrading Price Impact from 4/5 to 5/5 stars and Probability from 2/5 to 3/5 stars. The potential demand impact of ~1 kg silver per vehicle could reshape the entire market. The composite score increases from 8 to 15.
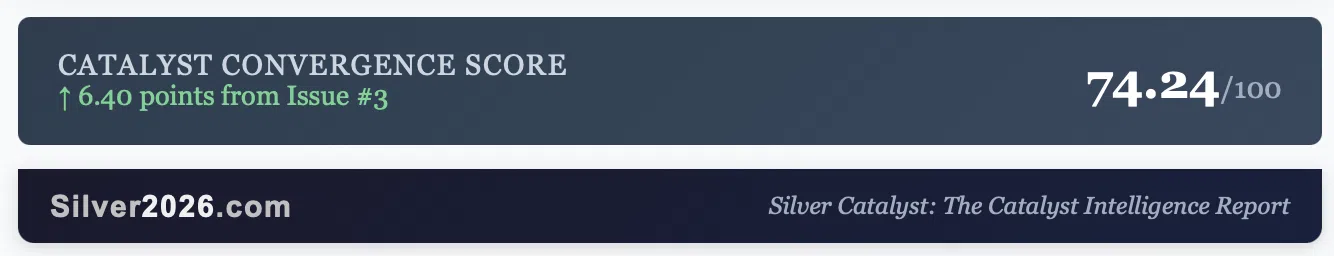
Convergence Score
Current Score: 74.24/100 (up from 67.84 in Issue #3 (includes calculation details), reflecting upgrades to #12 and #80)
The upgrades to catalysts this issue reflect the dramatic validation of structural market stress.
The gap between paper and physical markets is widening exactly as the Silver Rising’s FORCE Framework predicted.
2025 in Review: The Year Silver Broke Out
Key Milestones
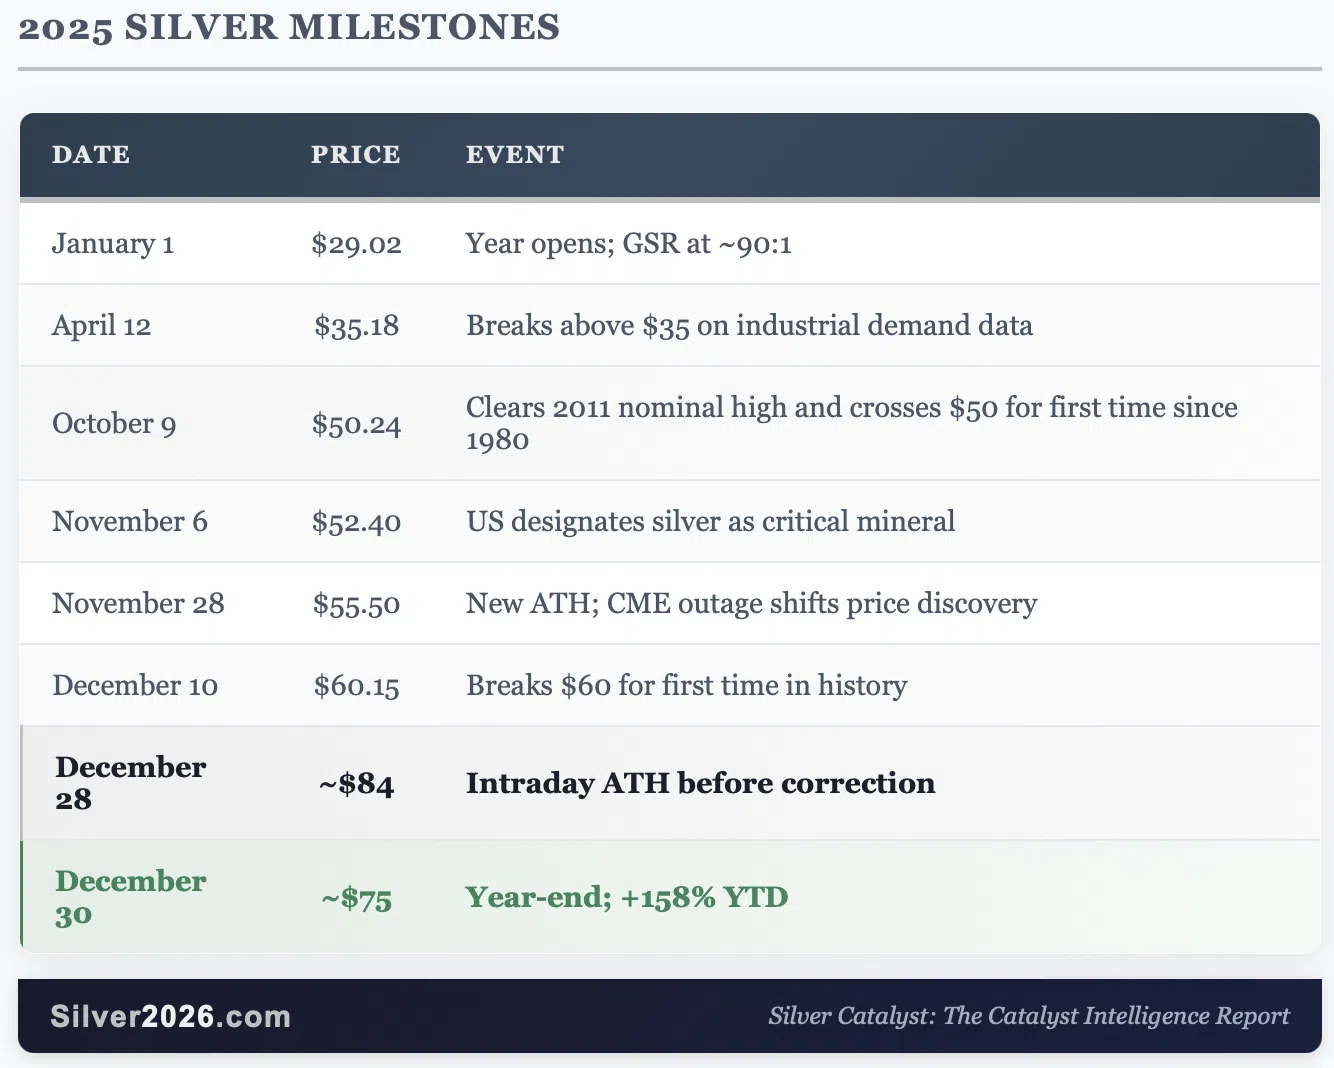
What Drove the Rally
The 2025 silver rally wasn't a speculation. It was the systematic convergence of structural factors:
- Fifth consecutive year of supply deficit (~820 Moz cumulative since 2021)
- Record industrial demand (680.5 Moz in 2024, continuing to grow)
- COMEX registered inventory collapse (down 70%+ from 2020)
- Central bank gold buying driving gold prices, pulling silver higher
- Three Fed rate cuts improving precious metals sentiment
- US critical mineral designation validating strategic importance
- China export restrictions tightening global supply
This is exactly the convergence scenario outlined in "Silver Rising." The catalysts aren't firing randomly; they're reinforcing each other in a cascade effect.
Important reminder: We've only discussed a handful of catalysts in this issue. The book identifies 100 catalysts across the FORCE Framework, and dozens more could trigger in the coming months, from solar demand acceleration to mining supply disruptions to monetary policy shifts. As a Silver Catalyst subscriber, you'll receive real-time updates as each catalyst develops. The situation is evolving rapidly, and staying informed will be critical for navigating what promises to be a historic period for silver.
Looking Ahead: What to Watch in January 2026
January 1: China Export Restrictions Take Effect
This is the most important near-term catalyst. Watch for:
- Shanghai-COMEX price spread widening
- Industrial buyer panic as supply tightens
- Potential delivery stress on COMEX
- Inventory draws accelerating
January 15: COMEX December Delivery Data
Final figures for December 2025 deliveries will reveal whether the physical squeeze intensified despite the price correction. The rumor of 7,300+ contracts (36.7 million ounces) standing for delivery needs confirmation.
January 29: Fed Meeting
The Fed's first meeting of 2026 will set the tone for monetary policy. Markets are pricing in further rate cuts, which would be bullish for precious metals.
Q1 2026: Samsung/Toyota Battery Updates
Watch for announcements on solid-state battery production timelines. Any acceleration of the 2027 mass production target would be significant for silver demand projections.
Announcement: The Catalyst Database Is Now Live!
I'm excited to announce that the is now complete and available online for all Silver Catalyst subscribers.
What's included:
- All 100 catalysts from "Silver Rising" with full analysis
- Current probability and price impact ratings
- Ability to comment and ask questions for specific catalysts
- Ability to suggest new catalysts -
Access it here:
Your input matters: You can comment on each catalyst separately, and I encourage you to do so. Share your observations, data points, and questions. Some of the best insights come from readers who are tracking specific industries or regions. This is meant to be a living resource that benefits from community engagement.
Submit Your Own Catalyst Ideas
I've also opened a portal for community catalyst submissions. If you've identified a development that could impact silver prices and isn't covered in the original 100, I want to hear about it.
Submit here:
Final Thoughts: The Math Doesn't Lie
Let me leave you with the numbers that matter:
- ~820 million ounces: Cumulative deficit since 2021 (Silver Institute confirmed)
- ~100-150 million ounces: 2025 estimated annual deficit
- 5,000+ metric tonnes: Potential annual deficit if China restricts exports by 50%
- ~32 troy ounces: Estimated silver per Samsung solid-state battery vehicle
- 64:1: Current gold-silver ratio (down from ~90:1)
- $8+: Shanghai premium over COMEX
The 11% crash on December 29 was painful for anyone who bought the top. But the math hasn't changed. The structural deficit hasn't changed. Industrial demand continues growing. China's export restrictions begin in 48 hours. COMEX inventories remain depleted.
The CME's margin hikes addressed speculative excess in the paper market. They did nothing to address the physical shortage that drove this rally.
The game hasn't changed. The rules just got more aggressive. Physical silver doesn't care about margin requirements.
Stay focused on things that really matter in the long run. That's what the engineering approach is all about.
Year-End Special: Secure Preferred Pricing for 2026
As we close out this historic year, I'm offering a limited (available only until the year-end fireworks) opportunity to secure your Silver Catalyst subscription for all of 2026 at a special rate. The ‘Silver Rising’ book (333 pages, 100 catalysts) is included.
Year-End Offer: $299 for Full Year 2026
This offer ends at the turn of the year.
Given what's ahead with China's export restrictions, continued supply deficits, the Samsung battery wildcard, and the ongoing convergence of catalysts, I expect 2026 to be even more eventful than 2025. Having real-time catalyst analysis will be more valuable than ever.
Secure the preferred pricing and be prepared for what 2026 can bring.
Thank you.
The Silver Engineer
Silver Catalyst is published bi-weekly by Golden Meadow®. This analysis is for educational purposes and does not constitute investment advice. Past performance does not guarantee future results. Always conduct your own due diligence.
Next Issue: On or before January 13, 2026