The widest paper-physical divergence in decades reveals who really controls the silver market.
Silver hit an all-time high of $121.78 on January 29, 2026.
Thirty hours later, it was trading at $78.53. A 38% crash. The largest single-day percentage decline in silver's modern history.
By February 6, a second wave pushed prices briefly to $63.90 intraday.
What happened next is more important than the crash itself.
The Crash Catalysts
The trigger was Kevin Warsh's nomination as Federal Reserve Chair, announced the evening of January 29. Markets repriced rate-cut expectations immediately.
But the crash wasn't just about the Fed. The CME Group hiked silver margins to 15% on January 30, forcing leveraged traders to liquidate. When prices kept falling, they hiked margins again to 18% on February 6.
A false Reuters article about U.S. metals policy added fuel. Algorithmic systems panicked. The article was later retracted.
Month-end positioning in thin liquidity amplified every move.
This is how paper markets work. Futures contracts change hands electronically. Margin calls trigger forced selling. Algorithms react to algorithms. Prices can move 40% in a day without a single physical ounce changing hands.
While Paper Prices Crashed, Physical Markets Diverged
Here's what most investors missed:
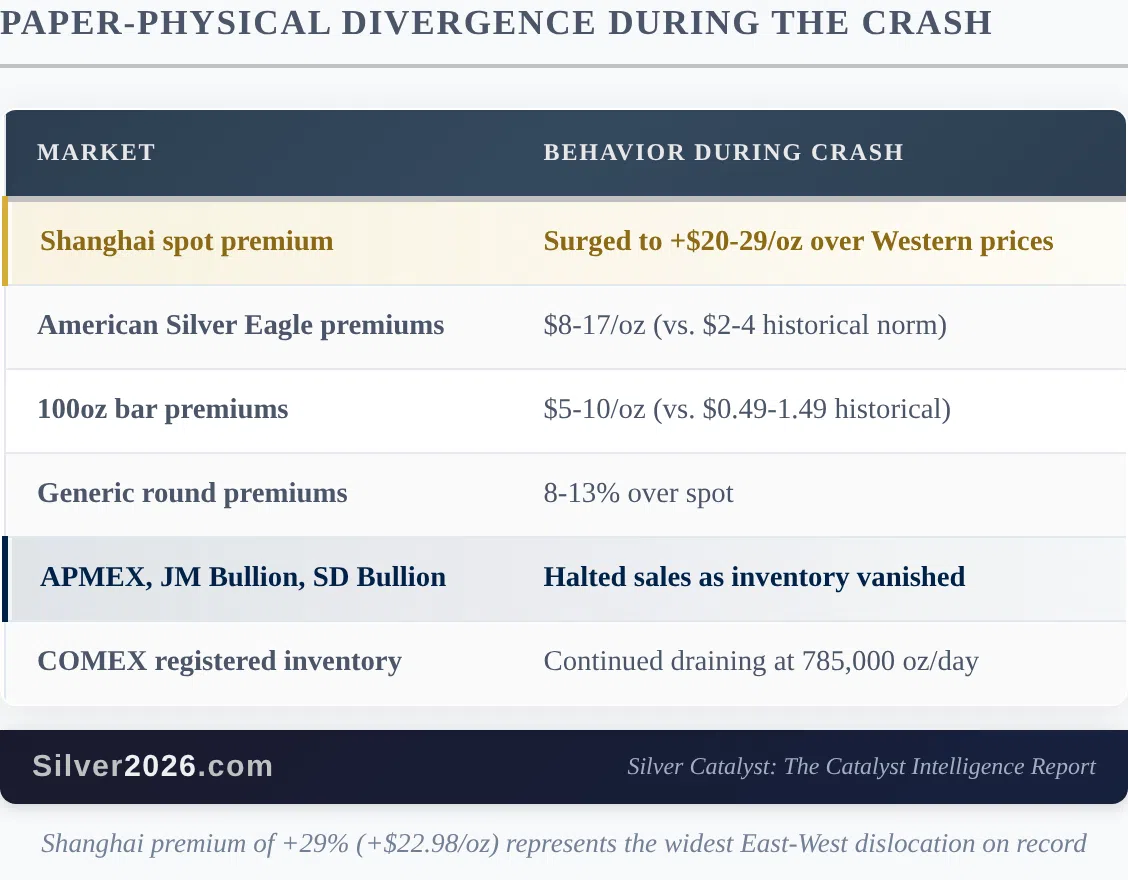
During the crash, the Shanghai silver market traded at a premium of $20-29 per ounce over Western prices. At the February 6 low, Shanghai spot silver was 29% higher than COMEX futures. Including China's 13% VAT, the total premium exceeded 45%.
This is the widest East-West price dislocation on record.
Major U.S. dealers responded to the crash by raising premiums, not lowering them:
- American Silver Eagle premiums: $8-17/oz (historical norm: $2-4)
- 100oz bar premiums: $5-10/oz (historical norm: $0.49-1.49)
- Generic round premiums: 8-13% over spot
APMEX, JM Bullion, and SD Bullion halted sales as inventory vanished.
Think about what this means. Paper prices crashed 38%. Physical dealers responded by charging more, and they still sold out.
COMEX Drainage Continued
While futures traders were liquidating, delivery requests accelerated.
January 2026 saw 49.4 million ounces of physical silver delivered through COMEX. That's 7.27 times the January 2024 delivery volume.
The February delivery month is tracking a 98% take-rate. Nearly everyone who had the right to demand physical delivery is doing so.
COMEX registered inventory now stands at 102.26 million ounces, down 38% from October 2025. At the current drainage rate of 785,000 ounces per day, registered inventory could fall below 85 million ounces before March's first notice day on February 27.
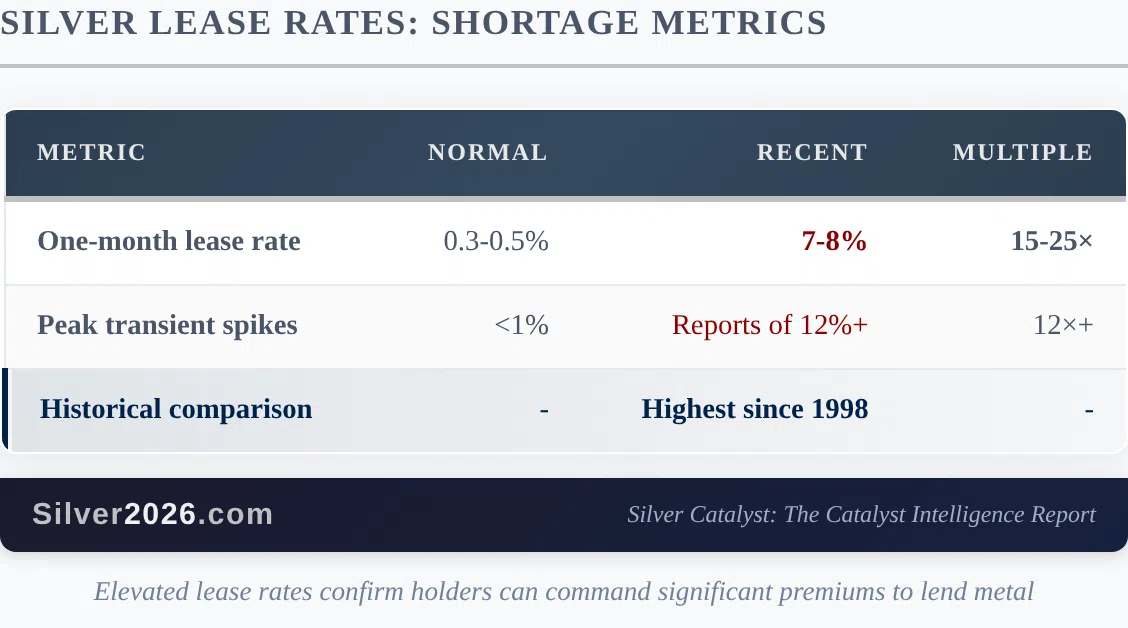
Lease Rates Confirm the Shortage
Silver lease rates measure how much holders can charge to lend their metal. Normal rates run 0.3-0.5%.
Current rates: 7-8%.
That's 15-25 times normal levels. Reports of transient spikes above 12% have circulated.
These are the highest lease rates since 1998.
Simultaneously, the silver market has entered backwardation. Spot silver is trading at a premium to futures. The backwardation reached $2.88 per ounce, the deepest since 1980.
In a normal market, futures trade at a premium to spot (contango) because of storage and financing costs. When spot trades higher than futures, it signals urgent demand for immediate physical metal.
The Exchange for Physical (EFP) spread, which measures the cost of swapping paper contracts for physical metal, expanded to $1.10 per ounce. That's 4.4 times the normal spread.
What This Means
The January-February crash demonstrated something important: paper prices and physical prices are increasingly disconnected.
Paper markets can be moved by margin hikes, algorithmic selling, and thin liquidity. Physical markets respond to actual supply and demand.
When leveraged traders were forced to sell, physical buyers treated it as a buying opportunity. Shanghai premiums surged. Dealer inventory vanished. Delivery requests accelerated.
The market structure stress indicators, including lease rates, backwardation, and EFP spreads, are all flashing red. These metrics don't move by accident. They reflect genuine scarcity of physical metal.
March 2026's COMEX delivery month presents a stress test. Open interest represents 425-528 million ounces of notional exposure against roughly 85-103 million ounces of projected registered inventory. That's a 4:1 to 5:1 paper-to-physical ratio for a single delivery month.
The crash may have shaken out leveraged paper traders. It didn't shake out physical buyers. If anything, it accelerated their accumulation.
The paper-physical divergence is one of 100 catalysts I analyze in "Silver Rising: 100 Reasons Why Silver Will Soar." The book bundle includes a 2-week trial of my Silver Catalyst newsletter.
Thank you.
The Silver Engineer