Predicting silver prices is linked to forecasting gold prices, as these markets typically align and validate each other's signals.
This is the case right now. I commented on gold’s small move higher yesterday, and today’s analysis will be dedicated to what we saw in silver (no surprise here – we saw something similar) and to how it fits the overall forecast for silver prices in July. Let’s start with white metal’s short-term chart.
Silver Price’s Short-term Predictions

As far as price is concerned, silver moved higher, but not significantly so. It’s down in today’s pre-market trading, so it seems that this small corrective upswing is already over.
It didn’t change anything as the price stayed below the sharply declining medium-term resistance line. But it’s not only the price movement that makes the current price forecast bearish. It’s also silver’s volume.
You see, silver moved higher on a very small volume, which is generally a bearish sign when it’s accompanying a rally. It theoretically should be the case that the prices rally on strong volume as many investors want to buy. But this is not what we saw recently. Instead, silver price rallied on low volume, which means both: bulls and bearish were rather hesitant and were mostly not participating in the trading at all. Therefore, the price move (rally) that happened was not really meaningful.
In fact, we saw this worked as a bearish indication last year. Silver price rallied in May 2022, but since this rally happened on low volume, it wasn’t a bullish indication. Silver price tumbled and declined shortly thereafter.
All in all, the short-term silver chart has bearish implications due to the declining resistance line that remained intact despite the recent rally and given the small size of the volume that accompanied the recent move higher.
Let’s check what’s the situation from the medium-term point of view.
Silver Price’s Medium-term Predictions
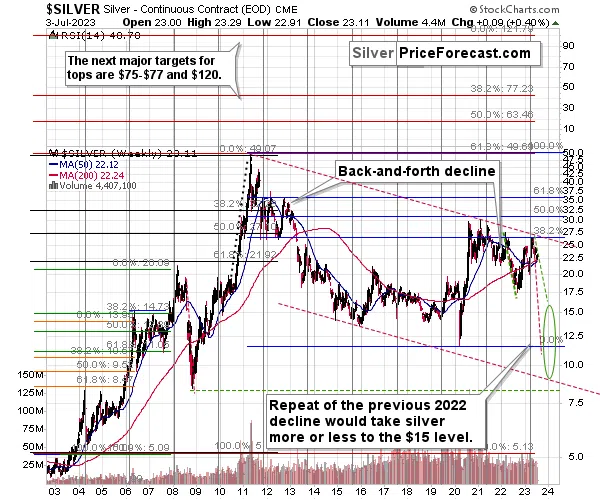
Taking a broad silver price picture into account allows us to see that silver is in a massive decline that started in 2011, despite a few impressive short-term upswings.
So much silver has been used in industry since 2008, so much money has been created, and yet, 15 years later, the price of silver is just a little higher than it was back then – in nominal terms. In real terms, it’s lower.
This – on its own – is an indication that silver probably hasn’t fallen enough in 2019, and another wave lower awaits it before it really soars in a truly spectacular manner.
And yes, that’s what I ultimately expect silver price to do – to shoot up well above its 2011 and 1980 highs. Very likely into triple digits. There are numerous reasons, but some of them are lower output and new ways to use silver in the electronic industry. There’s only one best electricity and heat conductor, and that’s silver.
In the medium run, however, it doesn’t look like silver is going to rally substantially – at least not before declining first.
It seems that the white metal just topped very close to its long-term cyclical turning point, just like it did in 2021, 2013, and 2008. The fact that it moved very close to its 38.2% Fibonacci retracement level based on the entire 2011 – 2020 decline and the declining red resistance line, and then it declined, making it very likely that it was indeed the medium-term top.
If that was the case, and silver is now about to decline just like it did during its previous major declines – in 2008 and 2012-2013, then it can decline to approximately its 2020 low (or even lower!) before turning up again in a meaningful manner.
Why would it repeat its 2008 or 2012-2013 performance? Because the history tends to rhyme, and the current situation in the interest rates suggests that a repeat of 2008 might indeed take place.
As far as the latter period is concerned, please note how similarly the SLV ETF moved after the 2011 top and after the 2021 top.

I added numbers to show how analogous the price patterns were.
There was even a similarity in volume levels!
The only difference is that this time, the move higher that I marked with 9 had the second higher top, but now it’s declining with less volatility. So, the earlier volatility is now being averaged out.
Those periods are very alike, and this has profoundly bearish implications for the following months due to what happened in 2013.
All in all, it seems that silver price is headed south in the near and medium term but that it’s likely to shoot up in the long run.
We might see a bigger (possibly tradable – allowing us to cash in profits from the short positions) rebound as early as this (or next) week, though.
Thank you for reading our free analysis today. Please note that the above is just a small fraction of the full analyses that our subscribers enjoy on a regular basis. They include multiple premium details such as the interim targets for gold and mining stocks that could be reached in the next few weeks. We invite you to subscribe now and read today’s issue right away.
Sincerely,
Przemyslaw Radomski, CFA
Founder, Editor-in-chief