The immaterial daily decline still leaves the silver price well above its fundamental value.
As hawkish economic data shift sentiment across the financial markets, seasonality is the last hope for the S&P 500 bulls. Yet, while the index is down noticeably from its November high, silver has continued its bullish run. However, with the ramifications of a higher FFR, higher real yields, a stronger USD Index and tighter financial conditions poised to bite in 2023, it could be a long way down before silver finds a lasting bottom.
To explain, we wrote on Dec. 15:
 Source: Bloomberg/ZeroHedge
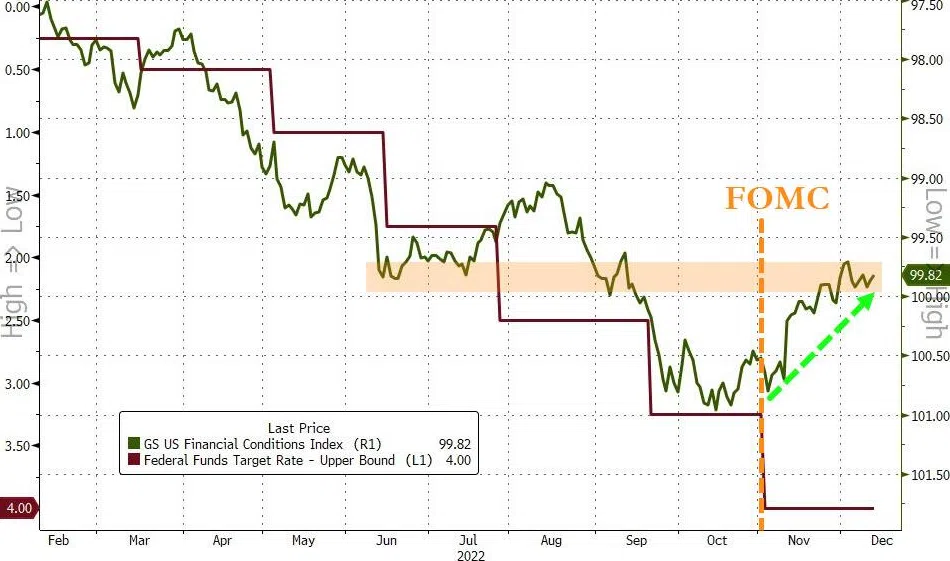
The dark red line above tracks the FFR, while the green line above tracks Goldman Sachs U.S. Financial Conditions Index (FCI). For context, both scales are inverted, and falling lines represent a higher FFR and tighter financial conditions.
If you analyze the relationship, you can see that a higher FFR resulted in tighter financial conditions, which meant financial markets aided the Fed in its inflation fight.
In contrast, the green line's rise on the right side of the chart demonstrates how higher stock prices, lower interest rates, a weaker U.S. dollar and smaller credit spreads support inflation and make the Fed's job harder. Again, that's why investors' hopes for a dovish pivot actually reduce the chances of one occurring.
So, the more the markets dissent, the more inflation will reign, and the higher the Fed will need to push the FFR. As a result, don't be surprised if economic reality haunts the pivot bulls in the months ahead.
To that point, while the silver price behaves as if QE is on the horizon, the U.S. 10-Year real yield has risen materially in December, and financial conditions are poised for another sharp run.
Please see below:
 Source: Bloomberg/ZeroHedge
To explain, the FFR-FCI chart above is identical to the original, only ZeroHedge flipped the scales and they’re not inverted. If you analyze the right side of the chart, you can see that the blue line (FCI) has bounced off its recent low as tighter financial conditions seep into the financial markets.
Moreover, notice how the FCI experienced several short-term pullbacks on its way to new medium-term highs? Well, this iteration should be no different.
With the consensus still underestimating the Fed’s inflation fight, the FFR should continue its ascent in the months ahead; and since the metric is bullish for the FCI, it’s likely only a matter of time before the pair reconnect at higher levels.
In contrast, silver is priced as if the opposite will happen, as the white metal’s rise implies that the FCI and the FFR are about to fall. But, the Fed needs tighter financial conditions to curb inflation, and a lower FCI is antithetical to that goal.
Therefore, while the Bank of Japan’s (BOJ) policy shock helped uplift the PMs, it’s a short-term distraction that holds little weight over the medium term. Conversely, we noted that nine of the last 10 inflation fights have ended with recessions since 1948; and with the S&P 500 often hitting new lows when recessions materialize, the painful process of reducing inflation should weigh on the silver price in 2023.
Please see below:

To explain, the blue line above tracks the current performance of the S&P 500, while the black line above tracks the median bear market performance when the U.S. economy avoids a recession. As you can see, 20% declines are erased rather quickly when a soft landing unfolds.
Conversely, the red line above highlights the median S&P 500 performance when bear markets culminated with recessions. If you analyze the right side of the chart, you can see that a final sell-off often emerges before a medium-term low is established. As a result, if a liquidation event confronts the index in 2023, the silver price will likely go down with the ship.
Furthermore, while bullish seasonality and a lack of short-term downside catalysts keep risk assets elevated, that should change dramatically as the Fed’s inflation fight continues.
Please see below:

To explain, the blue line above tracks the YoY percentage change in S&P 500 realized earnings per share (EPS), while the dashed orange line above tracks the model estimate from Morgan Stanley's non-PMI Leading Earnings Indicator.
If you analyze the relationship, you can see that the model has been quite accurate over the last ~20 years. Moreover, the dashed orange line's descent on the right side of the chart predicts a ~20% YoY decline in S&P 500 EPS in 2023, which rivals the ~17% and ~27% drops from the 2020 pandemic and the 2008 global financial crisis (GFC).
Consequently, if a recession hits, and the S&P 500's EPS falls by ~20%, do you think the silver price will remain uplifted?
Overall, the price action has clouded investors' judgment, as they assume that silver's ascent signals the fundamental all-clear. Yet, the white metal's rally has been driven by momentum, and has occurred despite the worsening economic backdrop. So, while a weaker USD Index helps, U.S. real yields have risen, and the FFR is still well below the historically-implied levels required to normalize inflation. As such, an abrupt end to silver's party should occur in 2023.
Alex Demolitor
Precious Metals Strategist