Is a breakdown below the 200-day MA next?
With silver plunging by more than 5% on Feb. 3, the white metal’s consolidation ended in dramatic fashion, and we warned that a breakdown was on the horizon. We wrote on Jan. 31:
While the S&P 500 suffered a material correction, silver continued its sideways price action. However, as time passes and silver stagnates, its 50-day moving average continues to rise. As a result, the white metal needs to rally soon, or a breakdown could occur in the coming days; and with the latter more likely than the former in our view, an S&P 500 drawdown could provide the necessary fuel.
Thus, with both the S&P 500 and silver suffering on Feb. 3, the ominous technical and fundamental realities ruled the day. Moreover, while the index’s short-term outlook remains neutral, more pain should confront stocks over the medium term.
For example, Bank of America’s Chief Investment Strategist Michael Hartnett told clients on Feb. 3 that the recent rally is like an “apocalypse postponed,” as an inflation reacceleration and a deeper-than-expected recession should materially shift sentiment in the months ahead. Likewise, he expects the market to peak as soon as Valentine’s Day (Feb. 14).
Please see below:
On top of that, the divergence between the U.S. stock market and bank reserves is an ominous sign for equities.
Please see below:
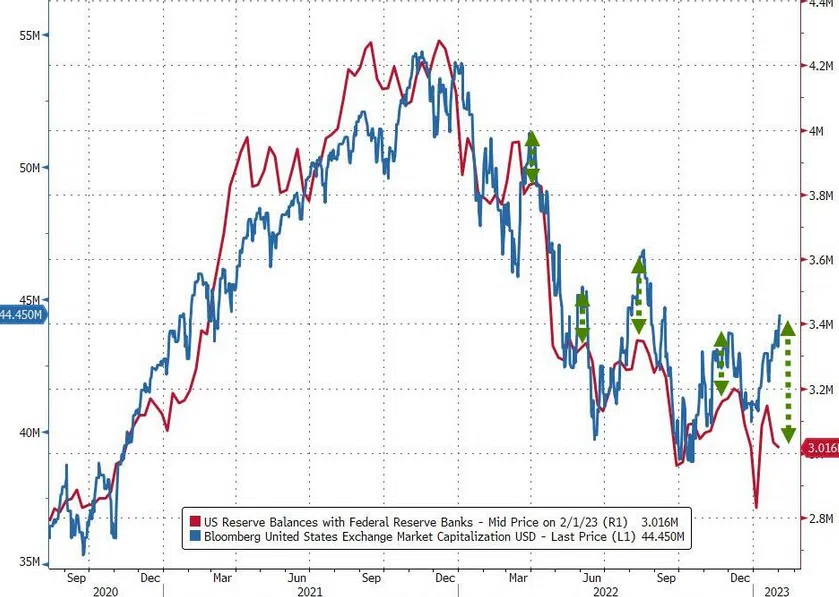
To explain, the red line above tracks U.S. commercial bank’s cash holdings, while the blue line above tracks the market cap of U.S. stocks. If you analyze the relationship, you can see that higher cash balances are often put to work in the market, which helps keep U.S. stocks uplifted.
Conversely, the red line has dipped on the right side of the chart while the blue line has risen. Therefore, with overbought conditions present and payrolls delivering a hawkish wake-up call, stocks could suffer as they catch down to liquidity.
On top of that, we’ve cited the importance of real yields on numerous occasions, but it’s not only the PMs that suffer when they rise.
Please see below:

To explain, the dark blue line above tracks the S&P 500’s forward price-to-earnings (P/E) ratio, while the light blue line above tracks the inverted (down means up) U.S. 10-year real yield. If you analyze the relationship, you can see that higher real yields compress multiples because cash and bonds become more attractive relative to stocks.
Similarly, while the U.S. 10-Year real yield has pulled back from its peak, an S&P 500 P/E multiple north of 18x is still too rich; and with higher real interest rates needed to combat inflation, the valuation impact implies more pain should confront the equity bulls over the medium term.
Finally, the Institute for Supply Management (ISM) released its U.S. Services PMI on Feb. 3. An excerpt read:
“ISM's New Orders Index registered 60.4 percent, up 15.2 percentage points from the seasonally adjusted December reading of 45.2 percent. New orders grew after contracting in December for the first time after 30 consecutive months of growth. Comments from respondents include: ‘Increased production due to new customers’ and ‘January is typically higher for us than December, as it's the start of a new year versus a holiday month.’
So, with the rise in new orders another sign of resilient demand, the economic backdrop supports higher, not lower, interest rates. As such, even though the payrolls outperformance helped increase hawkish expectations, investors are still pricing in rate cuts later in 2023.
Now, when the magnitude of those expected rate cuts declined on Feb. 3, the impact on the PMs was material; and if those cuts get priced out altogether – which should occur due to resilient growth and inflation – the hawkish shift could result in a further exodus from gold, silver and mining stocks.
Remember, we warned that Commodity Trading Advisors (CTAs) were extremely overweight the PMs, and their positioning is driven by momentum, not the technicals or the fundamentals. But, momentum cuts both ways; and while their continuous bid helped push the PMs higher, the Feb. 3 sell-offs highlight how quickly sentiment can change.
As a result, we expect more meaningful drawdowns in the months ahead, as evaporating liquidity, higher real yields, and a resurgent USD Index pressure several risk assets.
How meaningful was silver’s breakdown? Does the white metal recoup its 50-day MA ($23.38) or fall below its 200-day MA ($21.10)? Do you agree with Hartnett that the S&P 500 peaks by Valentine’s Day?
Alex Demolitor
Precious Metals Strategist