The precious metals market moved slightly higher on Friday, and we saw a subtle sign from gold miners’ and silver’s relative performances.
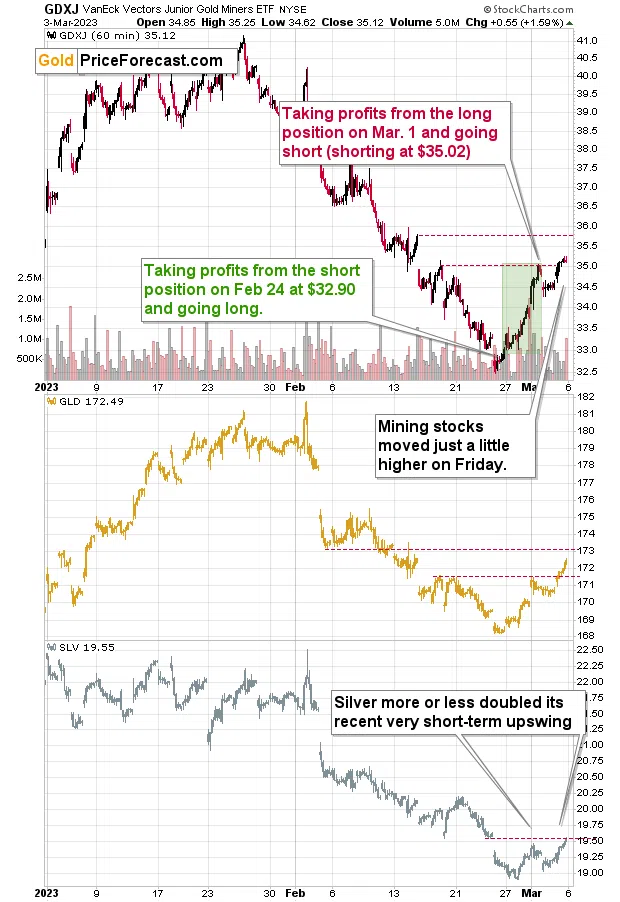
Namely, while the GDXJ (upper part of the chart) moved only a little above its recent high, silver has pretty much doubled its previous short-term upswing.
To be clear, neither of those moves higher was substantial. However, it is the relative performance that matters from an analytical point of view.
As I have emphasized many times before, miners tend to underperform gold close to tops, while silver tends to catch up. That’s something that we saw on Friday.
While it doesn’t guarantee that the top is already in, it does indicate two important things:
- It’s likely that the top is just around the corner (or it’s already in);
- The easy part of the rally was indeed most likely over on March 1, when we took profits from the recent long position.
In terms of resistance levels, the SLV ETF (a proxy for silver) hit the upper border of its recent price gap, while gold and silver haven’t moved to their next important resistance levels. They did move above the previous resistance levels and made a one daily close above them. This means that the small (very small in the case of the GDXJ ETF) breakout is not confirmed at this moment.
So far, gold and silver are both down in today’s pre-market trading (chart courtesy of https://www.SilverPriceForecast.com/).

Consequently, it wouldn’t be surprising to see the above-mentioned breakouts be invalidated shortly – perhaps as early as today.

Forecasting gold prices in the short run is not an easy task right now, as gold moved to one of its resistance levels (the mid-June 2022 high), but didn’t move to the combination of particularly strong short-term resistance levels yet. It doesn’t need to reach the latter, as the strong medium-term outlook remains to the downside and the RSI indicator has already moved to the middle of its trading range, thus doing what, back in mid-2022, meant that the key part of the rally was over.
Still, if gold were to move higher, to about $1,772, it would be likely to top there.
What does it all mean from broad point of view?
Pretty much nothing.
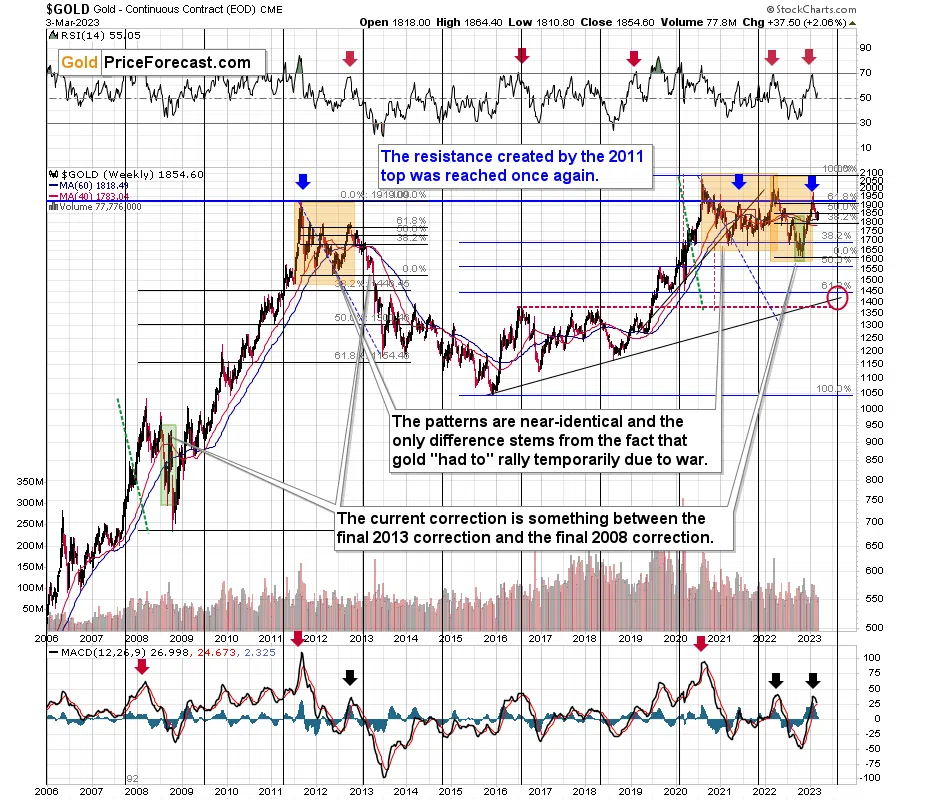
The possible additional tiny upswing in gold is likely to not even be visible on gold’s long-term chart, while the sizable medium-term downside is clearly visible.

It’s even clearer in the case of gold stocks. The possible tiny move higher is practically irrelevant from the long-term point of view, and taking into account how low the mining stocks are likely to slide (and how big our profits are likely to be thanks to this slide), it doesn’t make much sense to focus on it, especially since we already took profits on what seems to have been the easy part of the corrective upswing.
Thank you for reading our free analysis today. Please note that the above is just a small fraction of the full analyses that our subscribers enjoy on a regular basis. They include multiple premium details such as the interim targets for gold and mining stocks that could be reached in the next few weeks. We invite you to subscribe now and read today’s issue right away.
Sincerely,
Przemyslaw K. Radomski, CFA
Founder, Editor-in-chief