On April 15, the Silver Institute and Metals Focus published the 36th World Silver Survey, the most authoritative annual data release in the silver market.
It confirmed the sixth consecutive annual deficit and introduced a phrase that no prior edition has used: "an era of reduced stocks."
If you have been following this research for any length of time, the structural deficit in silver needs no introduction. Five consecutive years of documented shortfall, now entering a sixth.
What changed on April 15 is that the most credible institution in the silver market (the Silver Institute, whose World Silver Survey has been the benchmark annual data release since 1990) put its name on a conclusion that has been the central thesis of this research from the beginning.
From page 9 of the World Silver Survey 2026: silver "has clearly entered an era of reduced stocks. Tightness will not be constant, but liquidity will generally be thinner, lease rates more volatile and price moves likely to be larger than investors have grown used to."
That is the Silver Institute, in its flagship annual publication, describing a structural condition that has been building since 2021 and is now projected to extend through at least 2026.
There are eight Deep Dives in this week's premium Silver Catalyst issue, and in this article, I'll focus on one of them.
The Numbers the Survey Published
The headline supply and demand data for 2025 actuals and 2026 forecasts:
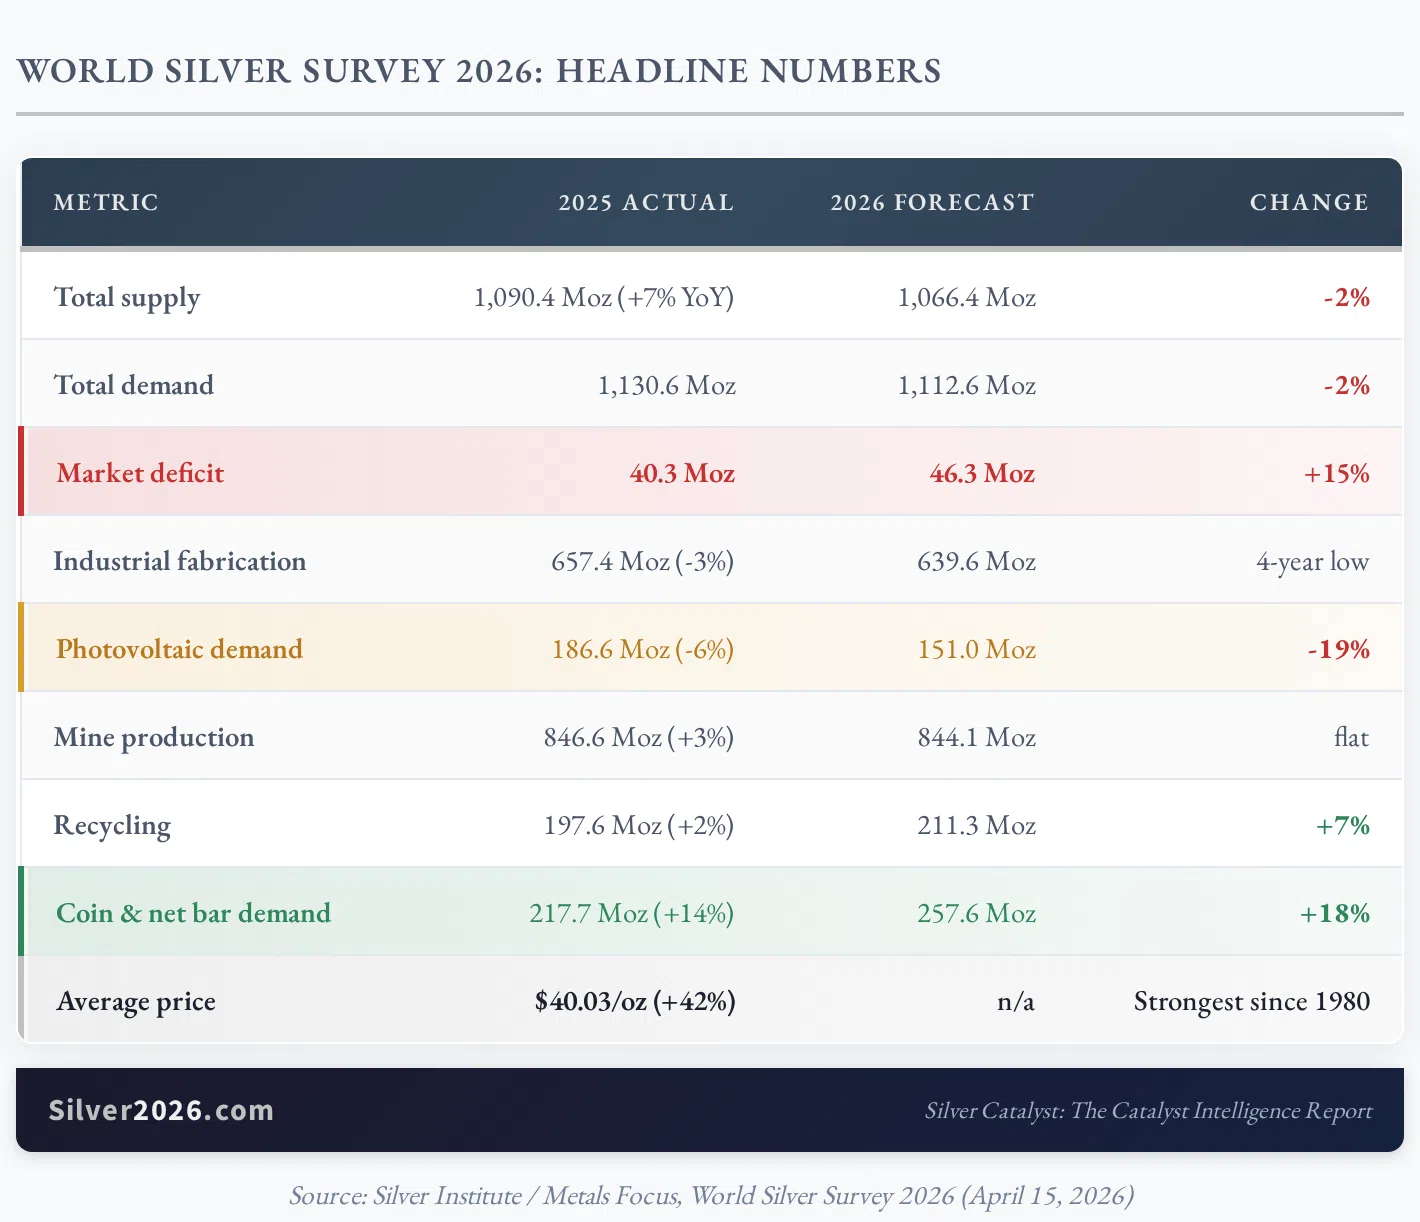
Sources: World Silver Survey 2026, Silver Institute / Metals Focus (April 15, 2026)
The lower number reflects what happened on the supply side. Total supply rose 7% in 2025, driven by mine production gains and a 13-year high in recycling as elevated prices pulled scrap back into the market. Both tailwinds are now exhausted or reversing. The 2026 forecast shows total supply contracting 2%, recycling growth slowing, and the deficit widening to 46.3 Moz despite demand also softening. The easy supply response has been used. What remains is the inelastic core.
Six Years, 762 Million Ounces
The Survey states the cumulative figure on page 17 in direct terms: "This year will be the sixth of a sustained deficit in the market, cumulatively 762.1Moz (23,705t)."
The progression:
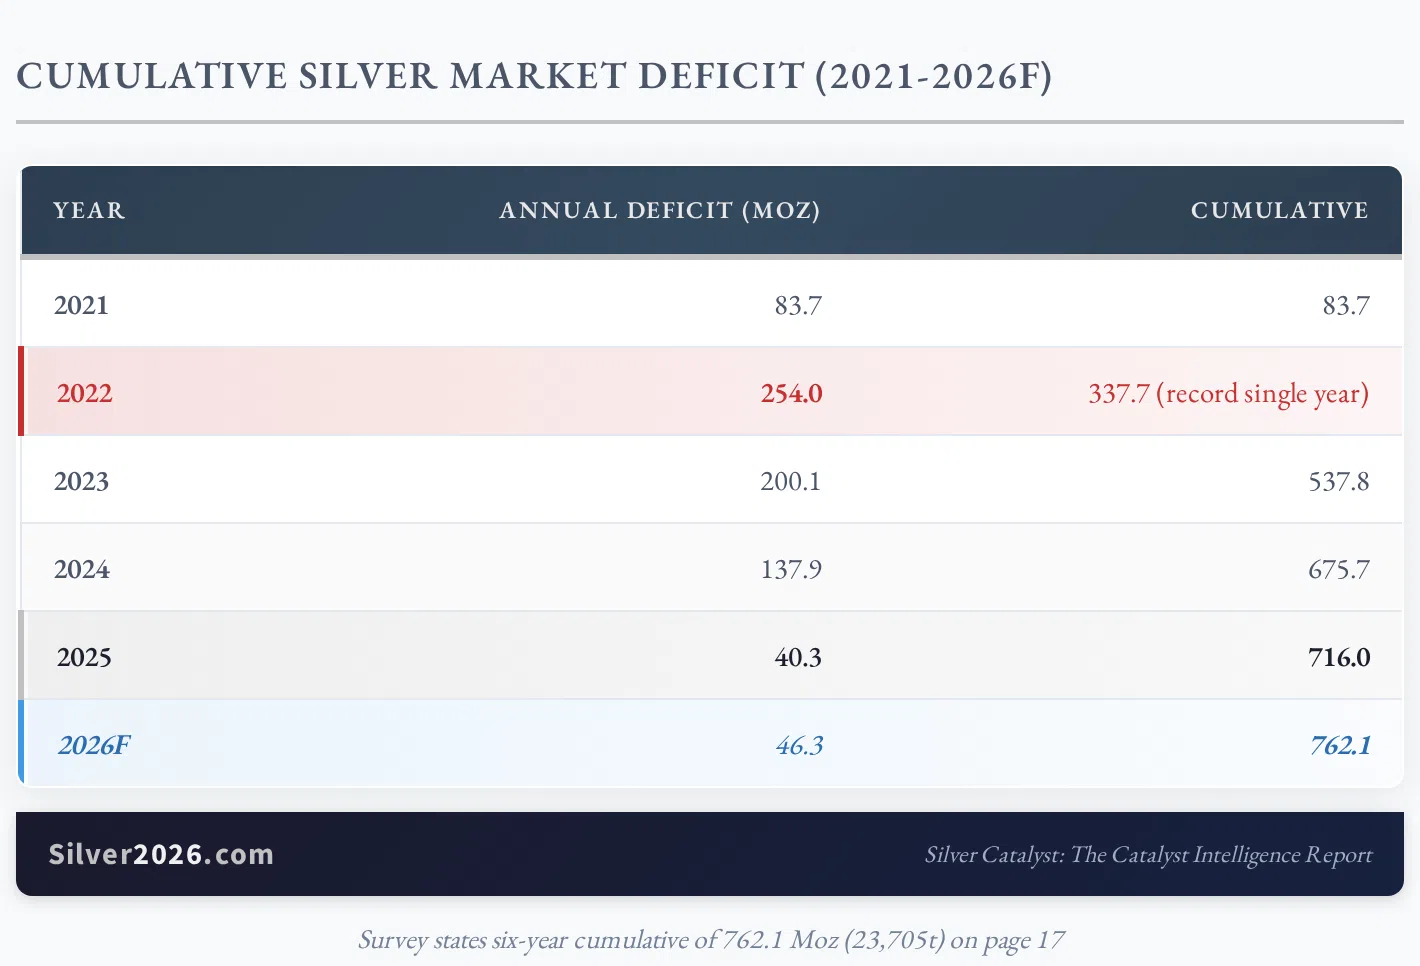
Sources: World Silver Survey 2026, Silver Institute / Metals Focus
To put this in context: Catalyst #4: Above-Ground Inventory Decline of 500 Million Ounces in Silver Rising was written around a 500 Moz threshold as the activation condition. The confirmed five-year actual is 716 Moz, already 43% above the threshold the book was built around. The six-year projection exceeds 762 Moz.
The original catalyst framing described this level of drawdown as the condition that would begin to create visible market stress. The Survey's "era of reduced stocks" language is the Silver Institute's way of saying that condition has arrived.
What the Supply and Demand Structure Actually Shows
Two numbers from the table above deserve more attention than the headline deficit figure.
Mine production forecast: 844.1 Moz for 2026 — essentially flat despite silver averaging $40.03/oz in 2025, up 42% year-on-year. In a normal commodity market, a 42% annual average price increase triggers aggressive mine expansion. It has not happened here because approximately 74% of silver is produced as a byproduct of base metal mining: copper, lead, and zinc operations that respond to those metals' economics, not silver's. Catalyst #7 in Silver Rising (Byproduct Dependency Breaking Supply Response) describes exactly this dynamic. The Survey's 2026 data confirms it in the clearest possible form: a 42% price year, and mine output that doesn't move.
Coin and net bar demand forecast: 257.6 Moz — up 18% from 2025's 217.7 Moz. That is a roughly 40 Moz year-on-year increase in investment demand, projected to arrive in a year when total demand is otherwise declining. The PV solar segment is retreating (down 19% to 151.0 Moz, a story the full premium issue covers in its own Deep Dive). But the physical investment demand is growing faster than PV is contracting. That 257.6 Moz coin and bar figure alone absorbs nearly the entire 2026 deficit projection of 46.3 Moz. The physical bid is structural, not episodic.
The Language Has Changed
The World Silver Survey does not typically venture into plain English. It is a data publication, careful in its framing, deliberate with qualifiers. The 2026 edition reads differently.
In addition to the "era of reduced stocks" passage, the Survey notes that the October 2025 squeeze (when the London silver market's available free float dropped to 17% of total inventories, pushing one-month lease rates from 1% to over 30% in weeks) was a direct consequence of structural conditions that have been building since 2021. The Survey describes it as the result of above-ground inventory drawdown creating a market with "fewer degrees of freedom." That is institutional language for: the system has less buffer than it used to.
For readers following the silver price analysis that has tracked this thesis since late 2025, the Survey's conclusions land as confirmation, not revelation. An institution with this level of data access reached the only conclusion the data supports.
The full Silver Catalyst Issue #14 covers seven additional Deep Dives beyond this one: the Hormuz war's paradoxical suppression of the silver price despite being a textbook inflationary shock; the COMEX May delivery cycle with 153 Moz of paper open interest against 77.12 Moz of registered metal; the solar demand reset and Fraunhofer ISE's 10x silver reduction breakthrough, with a forward trajectory through 2030; the SILVER Act and CFTC Chairman Selig's first endorsement of vault decentralization by a sitting US precious-metals regulator; Greater Bay Technology's all-solid-state battery A-sample rollout ahead of Toyota's timeline, alongside Tesla Cybercab production, Joby's Dubai launch, and SpaceX's 1,000th Starlink of 2026; India's Akshaya Tritiya records showing 25% trade growth against a price that tripled; and Fresnillo's Q1 confirming Mexico's silver output is in a third consecutive year of structural decline. The complete Catalyst Dashboard, institutional price forecasts, and Events to Watch through July are also included.
The market the Survey is describing — thinner liquidity, more volatile lease rates, price moves larger than investors have grown used to — is unfolding now. If you want the full picture, I encourage you to get Silver Rising with complimentary 2-week access to the Silver Catalyst newsletter.
Thank you.
The Silver Engineer