📌 Update - May 15th: Silver Has Since Pulled Back — Here Is What the Article Got Right
📌 Editor's note, May 15, 2026: This article was written on May 14, when silver was trading near $87. Silver dropped over 10% today on the back of a PPI print showing the steepest producer price spike since early 2022, which crushed rate-cut expectations across the board. The article anticipated this possibility directly — a consolidation after the 12.9% rally was described as "normal and possible," and the summit outcome was flagged as having delivered less than the May 11 rally had priced in. The structural arguments in the article remain unchanged.
The Trump-Xi summit is over. No formal tariff extension was announced. Trump told reporters he did not discuss tariffs or computer chips with Xi directly. The US trade representative, asked whether the October trade truce would be extended, said only "we'll see." Xi warned that mishandling Taiwan could put the relationship "in great jeopardy." Both sides agreed to a "strategic stability" framework and scheduled a follow-up meeting in the US on September 24. That is a continuity agreement, not a new deal.
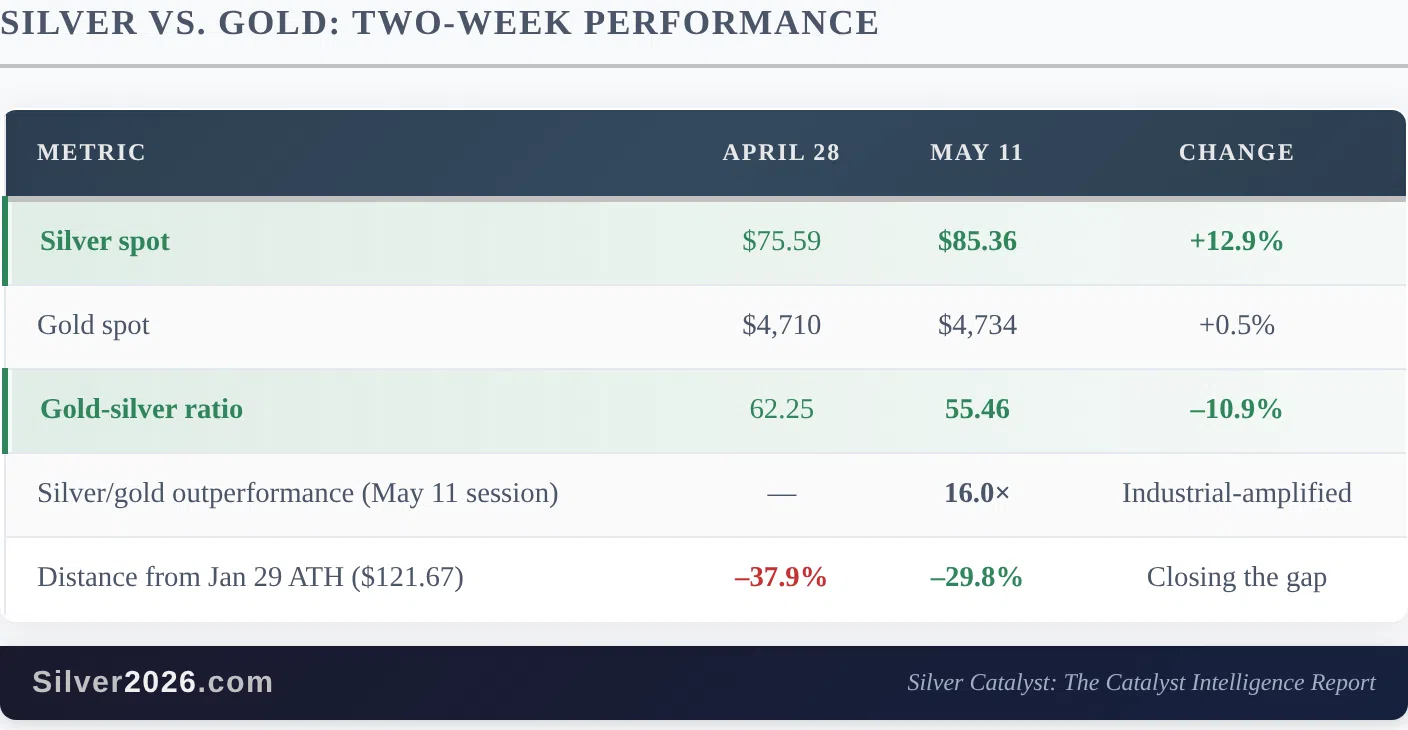
Silver entered this summit trading near $85, having gained 12.9% in the thirteen days prior. The May 11 rally that took silver from $80 to $85.36 in a single session was explicitly driven by summit anticipation: markets pricing in the likelihood that a trade truce extension would benefit the solar, semiconductor, and electronics supply chains that consume silver most heavily. The summit delivered less than that rally priced in.
And yet silver is holding near $85.
That is the signal worth paying attention to. When an asset rallies on a catalyst and then holds its gains after the catalyst disappoints, it tells you the underlying bid is coming from somewhere else. In the April 28 issue, I described the gold-silver ratio at 62.25 as a market that had not yet priced in silver's industrial story. That ratio now sits at 55.46, compressed entirely by silver rising rather than gold falling. The summit did not create that move. It accelerated a repricing that the structural fundamentals had been building toward for weeks.
Silver's 16-to-1 Session and What the Beijing Summit Just Confirmed
The May 11 rally had a specific trigger: markets were positioning ahead of the Trump-Xi summit in Beijing, which ran May 13 to 15. Most of the global silver supply chain runs through US-China trade. The solar panels, semiconductors, and electronics that consume silver are manufactured overwhelmingly in China or with Chinese components. When trade relations between the US and China stabilise, the outlook for the industries that consume silver most heavily improves. That is what markets were pricing on May 11.
This outcome is almost exactly what the Council on Foreign Relations assessed on May 10 would happen: a limited stabilisation, not a transformation. CNBC's post-summit analysis described it as "strengthening a fragile trade truce" rather than resolving the underlying structural conflicts. Xi's "strategic stability" framework for three years is Beijing securing predictability, not Washington securing concessions.
For silver, this creates a nuanced picture.
The May 11 rally priced in a summit that would deliver a full trade truce extension. What the summit actually delivered was a continuation of the status quo with a September follow-up. Some of that optimism may unwind in the near term, and a consolidation from $85 after a 12.9% two-week move would be entirely normal.
But step back from the summit and the picture is different. The gold-silver ratio at 55.46 is still well above its 20th-century average of 47 to 50. A return to that historical norm at current gold prices implies silver near $95 to $100. The ratio compression that drove the May 11 session was not manufactured by the summit; the summit was simply the catalyst that accelerated a repricing that the fundamentals had been building toward for weeks.
Why Silver Moves More Than Gold When Trade Improves
J.P. Morgan has noted that silver's industrial weighting makes it materially more sensitive to trade and manufacturing expectations than gold. The mechanism is straightforward: when US-China trade relations deteriorate, manufacturers who rely on silver-intensive supply chains cut back on procurement and production planning. When those relations stabilise, procurement accelerates. Because silver's investable market is small relative to the size of those industrial flows, the repricing happens fast and hard.
The two-week window illustrated this in real time. The ratio dipped toward 58.4 on May 7 when Iran peace talks briefly looked promising (an industrial demand signal, not a fear signal). It recovered toward 60 mid-week when Trump rejected Iran's counterproposal as "totally unacceptable." Then it collapsed to 55.46 as summit optimism built ahead of May 13. Every move tracked the industrial outlook. Goldman Sachs continues to describe silver as the primary strategic metal of the green transition, and that framing is precisely why trade stabilisation moves silver so sharply: the green transition supply chains are overwhelmingly US-China dependent.
What the summit did not change is the structural supply picture. The World Silver Survey 2026 has already confirmed a sixth consecutive annual deficit, forecast by Metals Focus and the Silver Institute at 46.3 Moz for 2026. COMEX registered inventory sits at 79.88 Moz, with a coverage ratio of 13.4%, the seventh consecutive month below the 15% stress threshold. The Glencore Kazzinc explosion on May 5 put 3.4 Moz of annual byproduct silver at acute risk. Iran-war energy costs, as quantified by Gold Fields for the first time in their Q1 results, add $40 to $50 per ounce to mine operating costs at $100 oil. None of those supply constraints were on the summit agenda.
Catalyst connections:
- Catalyst #50 (Gold-Silver Ratio at 87-100:1 vs. 47-50:1 Historical Average): the ratio at 55.46 remains well above the 47 to 50:1 historical norm; a return to that average at current gold prices implies silver near $95 to $100, independent of any summit outcome.
- Catalyst #51 (Market Size Differential Creating Amplification Effects): the 16-to-1 single-session outperformance is the amplification effect in live action; silver's smaller investable market turns industrial-demand repricing into outsized price moves.
- Catalyst #92 (Trade War Escalation Disrupting Global Supply Chains): the summit's "strategic stability" framework for three years is a bullish signal for the silver supply chains that run through US-China trade, even without a formal tariff extension.
The Outlook
After a 12.9% move in two weeks, a pullback or consolidation is normal and possible. The summit outcome delivered less than the May 11 rally priced in. Markets may take some time to digest that gap between expectation and reality.
But the fundamental drivers that pushed silver from $75 to $85 are not resolved by the summit outcome. The sixth consecutive deficit is the structural foundation. The supply constraints from mining cost inflation, byproduct disruptions, and COMEX delivery stress are independent of US-China diplomacy. The gold-silver ratio at 55.46 still has significant room to compress toward its historical norm.
The silver price analysis throughout 2026 has been tracking these structural forces since the beginning of the year. The May 11 session did not create them; it confirmed that markets are beginning to price them in.
The full Silver Catalyst Issue #15 contains five more Deep Dives covering: the most divided Fed vote in 34 years and what three historical precedents say about silver during central bank paralysis; the Glencore Kazzinc explosion and the 3.4 Moz byproduct gap that no silver mine can fill; Gold Fields' first-ever quantification of Iran-war oil costs hitting the mine cost stack at $40 to $50 per ounce; the April CPI stagflation reading at 3.8% and its historical precedents for silver; and Q1 2026 producer reporting showing simultaneous grade decline at three major miners. If you want to stay informed as this market develops, I encourage you to get "Silver Rising" with complimentary 2-week access to the Silver Catalyst newsletter.
Thank you.
The Silver Engineer